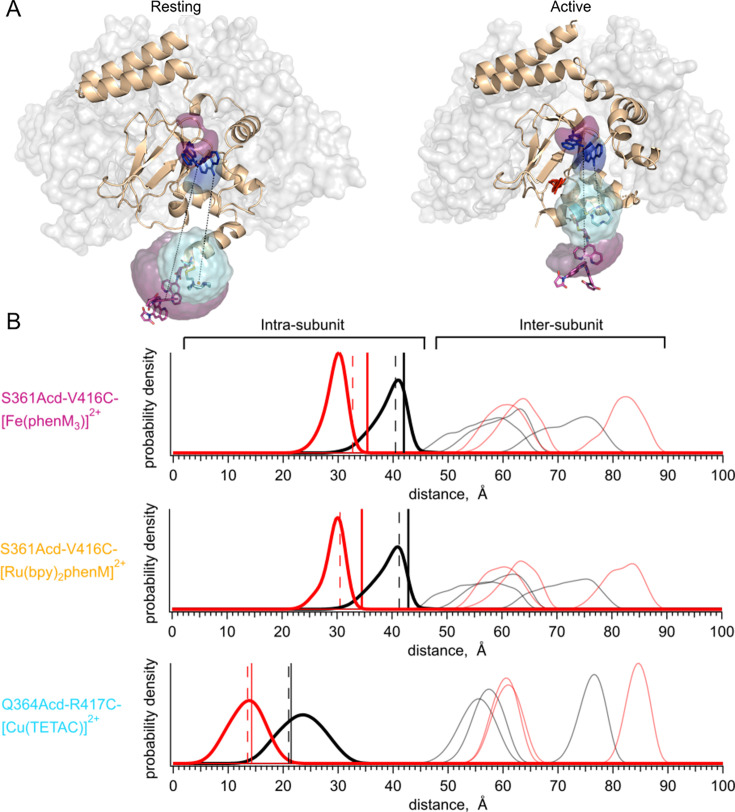
Figure 4. Distance distribution predictions with chiLife.
(A) Structure of resting state (left, PDB:7RSH) (Gao et al., 2022), and cAMP-bound active state (right, PDB:4D7T) (Kesters et al., 2015) with rotameric clouds predicted by chiLife for the labels (Acd, blue; [Fe(phenM)3]2+, magenta; and [Cu(TETAC)]2+, cyan). Gray surface indicates location of adjacent WT subunits in tetramer. (B) Distance distributions predicted by chiLife for SthKCterm-S361Acd-V416C-[Fe(phenM)3]2+, SthKCterm-S361Acd-V416C-[Ru(bpy)2phenM]2+ and SthKCterm-Q364Acd-R417C-[Cu(TETAC)]2+ (intra-subunit distances: resting, black curves; active, red curves; and inter-subunit distances: resting, grey curves; active, pink curves). Average steady-state tmFRET distance measurements are overlayed as vertical lines for data from Figure 3 (apo, solid black, and cAMP, solid red) and adjusted assuming a 10% unlabeled protein (dashed black and red vertical lines).

