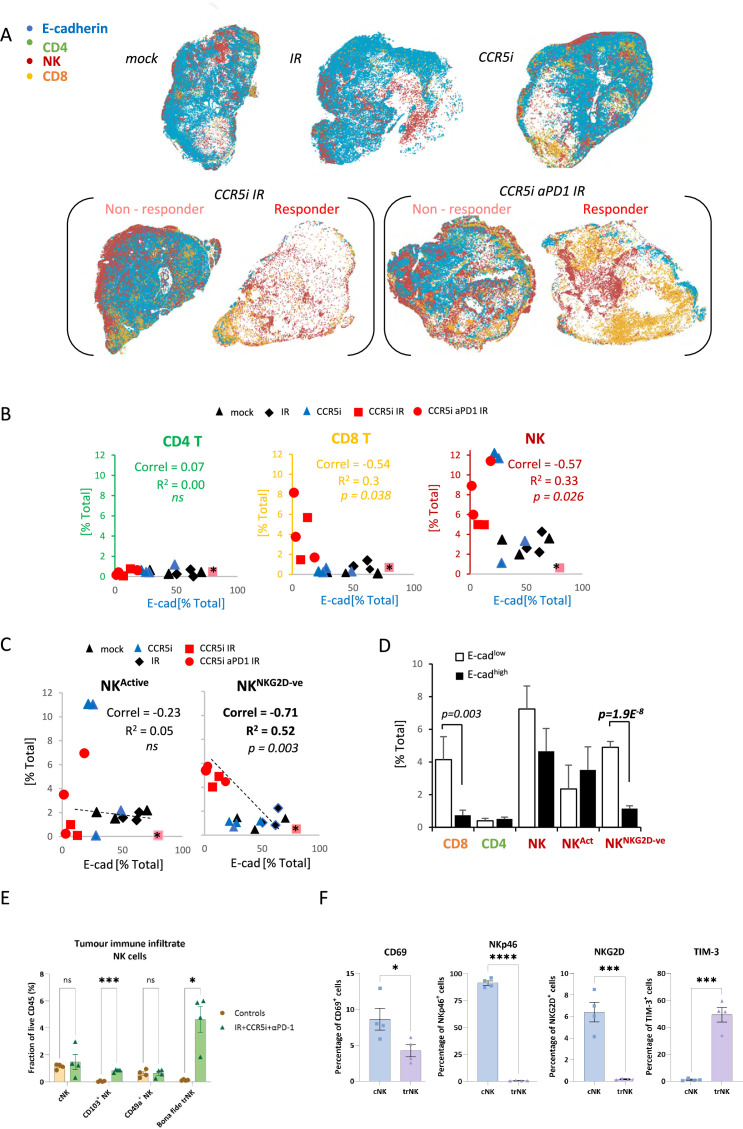
Figure 4. Non-cytotoxic natural killer (NK) cells associate with tumor control.
(A) Spatial plots of individual cells identified using HALO software of scanned multiplex immunofluorescence murine orthotopic pancreatic tumor slices. Positive staining is identified as the marker of interest and DAPI+ (nucleus stain) signal. Responders and non-responders to treatment are based on loss of E-cadherin staining. (B) Correlations of total CD4 T (CD3+CD8-), CD8 T (CD3+CD8+), and NK cells (CD3-NK1.1+) plotted against %positive E-cadherin+ cells as derived from (A). (C) Correlation of %positive segregated NK cells plotted against %positive E-cadherin+ cells as derived from (A). K cells were segregated based on expression of NKG2D; NKActive; NK1.1+NKG2D+; NKNKG2D-ve; NK1.1+NKG2D-. (D) Intra-tumoral immune cells of stratified pancreatic tumors based on low or high E-cadherin percentage (cut-off: 20%). Significance was tested for p<0.05 with a two-tailed Student’s t-test. *Censored non-responder. (E) Proportion of infiltrating tissue-resident NK (trNK) (Live/CD45+CD3-CD19-NK1.1+CD103+CD49a+), conventional NK cells (Live/CD45+CD3-CD19-NK1.1+CD103-CD49a-), CD103+ NK, and CD49a+ NK cells isolated from orthotopic pancreatic tumors of mice treated with the IR+IT regimen and controls, as a percentage of CD45+ cells. Significance was tested for p<0.05 with a Student’s t-test. (F) Comparative surface expression of activation marker (CD69), activating receptors (NKp46, NKG2D), and exhaustion marker (TIM-3) on conventional NK (cNK) cells and trNK cells isolated from orthotopic pancreatic tumors. Significance was tested for p<0.05 with a Student’s t-test. *p<0.05, ***p<0.005, ****p<0.001.


