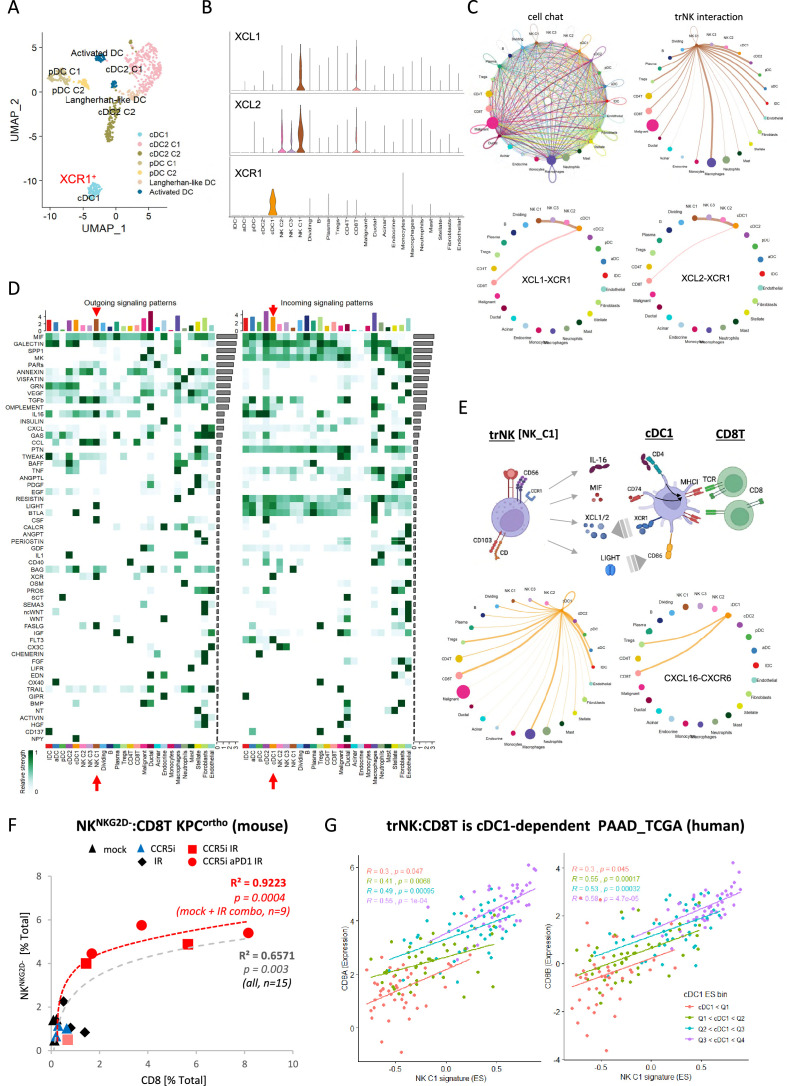
Figure 6. CellChat communication indicates tissue-resident natural killer (trNK) communicate directly to cDCs.
(A) Uniform manifold approximation and projection (UMAP) of the dendritic cell sub-clusters from the Steele dataset. (B) Violin plot showing the expression of XCL1, XCL2, and XCR1 across all cell types. (C) Circle plots showing interactions across all cell types (top left), signals coming from the tissue-resident natural killer (trNK) cells (top right), the XCL1-XCR1 interaction (bottom left), and the XCL2-XCR1 interaction (bottom right). The width of edges represents the communication strength. (D) Heatmap showing the summary of secreted signaling communications of outgoing (left) and incoming (right) signals. The color bar represents the communication strength, and the size of the bars represents the sum of signaling strength for each pathway or cell type. (E) Schematic overview of the trNK to type 1 conventional dendritic cell (cDC1) and cDC1 to CD8 T-cell communication axis (top). Circle plots of all outgoing signals from cDC1 (bottom left) and the CXCL16-CXCR6 signaling (bottom right). (F) Correlation of HALO data on total NKNKG2D-ve NK cells (CD3-NK1.1+NKG2D-) with CD8 T-cells (CD3+CD8+) from stained sections of treated KPC_F orthotopic tumors, R2 and p-values indicate positive correlation across all tumors (gray, n=15) or limited to mock, CCR5i+IR and IR/CCR5i/αPD1 combination (red, n=9). (G) Correlation of trNK signature with CD8A (left) or CD8B (right) in bulk RNA-seq from TCGA_PAAD and binned into quartiles based on extent of cDC1 involvement as assumed by cDC1 signature (Figure 6—source data 1).


