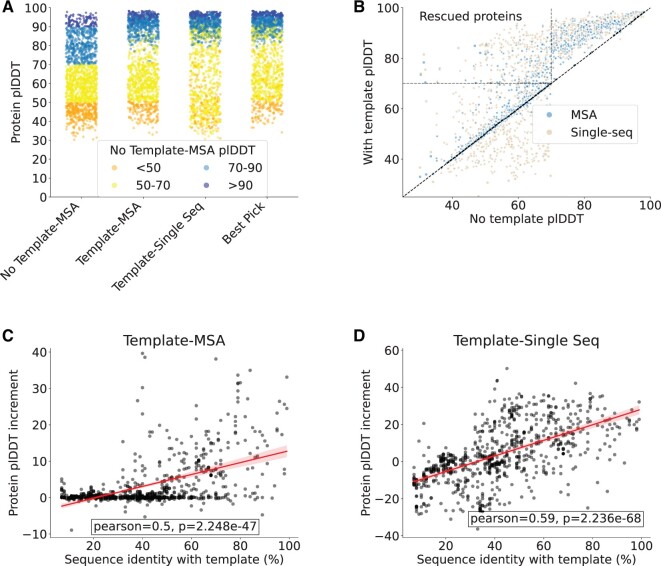
Figure 3.
(A) Protein plDDT generated by running ColabFold with MSA and no template, with template and MSA or with template and single sequence (N = 1460). (B) Scatter plot showing the plDDT variation in the presence or absence of a template. Note that the “No template” condition modelling was done solely with the MSA option. Rescued proteins are those proteins for which the plDDT increased above 70 after the use of templates. As a positive control, templates were also used to remodel proteins which already exhibited a plDDT above or equal 70 without the use of templates. A plDDT improvement was expected for this set of proteins because the templates adopted coincided with the proteins to be modelled. Indeed, it has already been shown that AlphaFold2 is overly confident when it finds a perfect match between the sequence to model and the provided template (Roney and Ovchinnikov 2022). This explains why in the right hand region of the plot all the observations fall above the identity line (dotted black line). A high plDDT variability is found for proteins modelled in the presence of a template and single sequence: low plDDT values are observed when the template is too distant from the protein to be modelled. In these cases, the use of a MSA is preferable. (C) plDDT increment in proteins modelled with a template and MSA or with templates and single sequence (D) correlates with the sequence identity with the closest template used (N = 729). 95% confidence interval is shown in the trend lines. Sequence identity was calculated with PairwiseAligner from the Biopython module using BLOSUM62 as substitution matrix and global alignment option.

