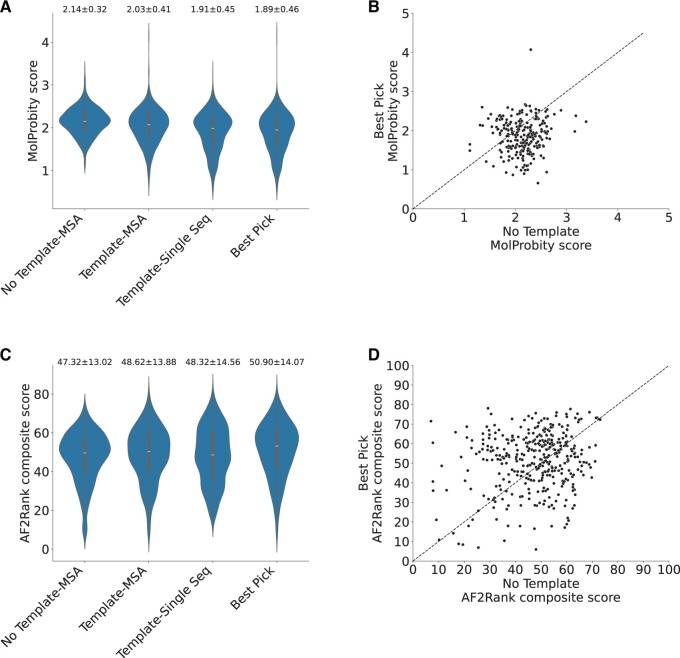
Figure 4.
(A) Violin plot showing the distribution of MolProbity scores in different conditions (N = 728). (B) Scatter plot showing the distribution of MolProbity scores in the conditions “No Template” and “Best Pick.” Best Pick models have higher quality as shown by the lower MolProbity scores compared to No Template ones and confirmed by statistical analysis (Wilcoxon paired, one-sided; P-value: 2.61e−45). The dotted black line represents the identity line. (C) Violin plot showing the distribution of AF2Rank composite scores in different conditions (N = 728). (B) Scatter plot showing the distribution of AF2Rank composite scores in the conditions “No Template” and “Best Pick.” In this case, the higher quality Best Pick models is less evident from the distribution but it is nonetheless statistically significant (Wilcoxon paired, one-sided; P-value: 5.18e−19). The dotted black line represents the identity line. Average value and standard deviation are reported on top for (A) and (C).

