. 2024 Dec 6;26(1):bbae634. doi: 10.1093/bib/bbae634
© The Author(s) 2024. Published by Oxford University Press.
This is an Open Access article distributed under the terms of the Creative Commons Attribution Non-Commercial License (https://creativecommons.org/licenses/by-nc/4.0/), which permits non-commercial re-use, distribution, and reproduction in any medium, provided the original work is properly cited. For commercial re-use, please contact journals.permissions@oup.com
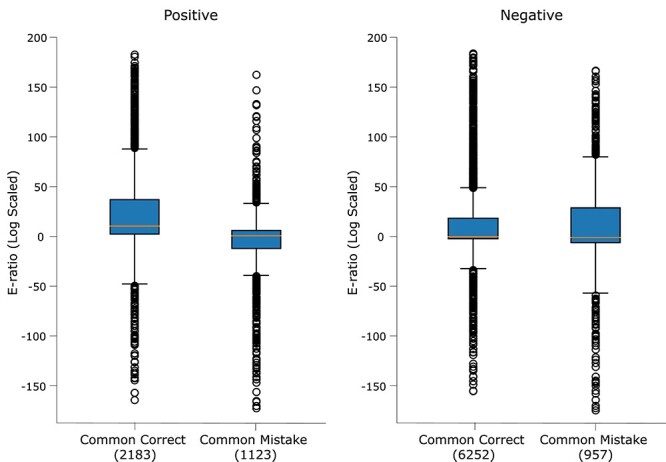
Figure 5.

E-ratio plot for positive (left) and negative (right) test samples.
