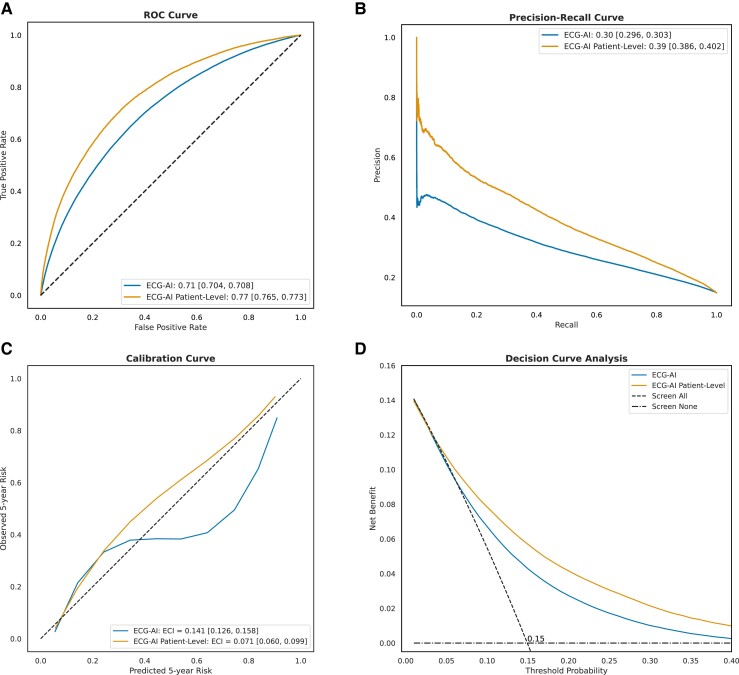
Figure 7.
Performance assessment of electrocardiogram-based deep learning (ECG-AI) in the Medical Information Mart for Intensive Care-IV (MIMIC-IV) external validation data set (109 870 patients, 437 323 ECG). (A) The receiver operating characteristic curve, plotting the true positive rate against the false positive rate for each model, with the area under the curve indicating discriminatory power (reported in legend). (B) The precision–recall curve, plotting precision against recall with the area under the curve reported in legend. (C) The calibration curve, showing the relationship between predicted and observed 5-year atrial fibrillation risk; the slope and intercept are calculated using linear regression, and the curve is plotted using a univariate spline with smoothing factor of 1. The estimated calibration index (ECI, reported in legend) is the root mean squared difference between the mean predicted probabilities and the spline-fitted calibration curve. (D) The decision curve analysis, plotting net benefit against threshold probability.

