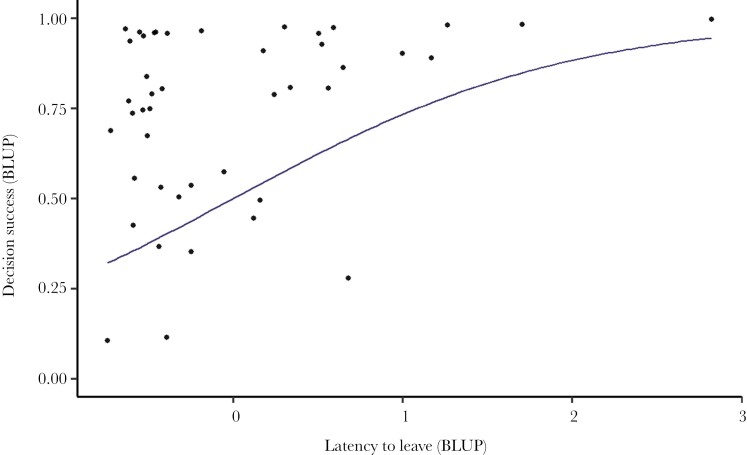
Fig. 3.
The relationship between latency to emerge from the start chamber varies with decision success in maze trials. The line shows the estimated regression slope (calculated as the among-individual covariance between these traits divided by the among-individual variance in latency, with predictions for this range of values transformed into probability space on the y-axis). Points show the best linear unbiased predictors (BLUPs) for individual fish latencies as estimated from the fitted multivariate model. For decision success, these were added to the overall intercept estimate from the model for transformation into probabilities. N = 44 fish, estimates from 25 trials.

