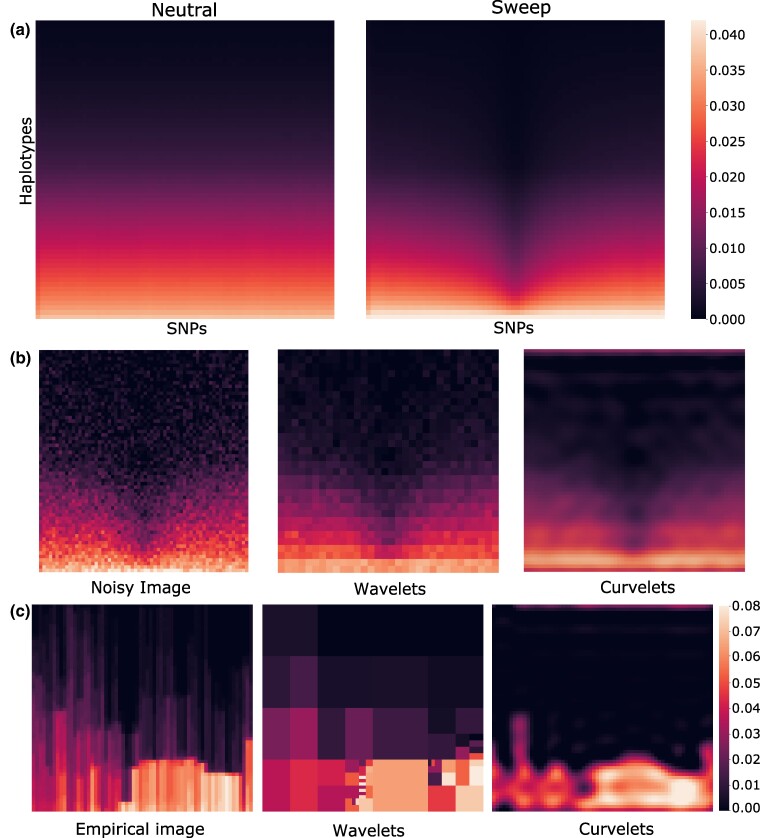
Fig. 1.
Image representations of haplotype alignments and their sparse reconstructions. Darker regions correspond to higher prevalence of major alleles. a) Heatmaps representing the -dimensional original haplotype alignments used as input to α-DAWG, averaged across 10,000 simulated replicates for either neutral (left) or sweep (right) settings. The mean sweep heatmap (right) shows the characteristic signature of positive selection, with a loss of genomic diversity (vertical darkened region) at the center of the haplotype alignments where a beneficial allele was introduced within sweep simulations. In contrast, this feature is absent in the mean neutral heatmap (left). b) Reconstructed images of a noisy signal with wavelet and curvelet decomposition. The noisy image was generated by adding Gaussian noise of mean zero and standard deviation one to the mean sweep image depicted in panel (a). For sparse reconstruction from wavelet and curvelet coefficients, we employed a hard percentile-based cutoff, where only the one percent of coefficients with largest magnitude values were retained for the image and the remaining coefficients were set to zero. While both sparse reconstruction approaches capture the overall signal in the noisy image, the curvelet reconstructed image is smoother than the wavelet reconstructed image. c) Sparse reconstruction of haplotype alignments for a genomic region encompassing the CCZ1 gene on human chromosome 7 from wavelet and curvelet coefficients in which hard percentile-based thresholding was employed as in panel (b).

