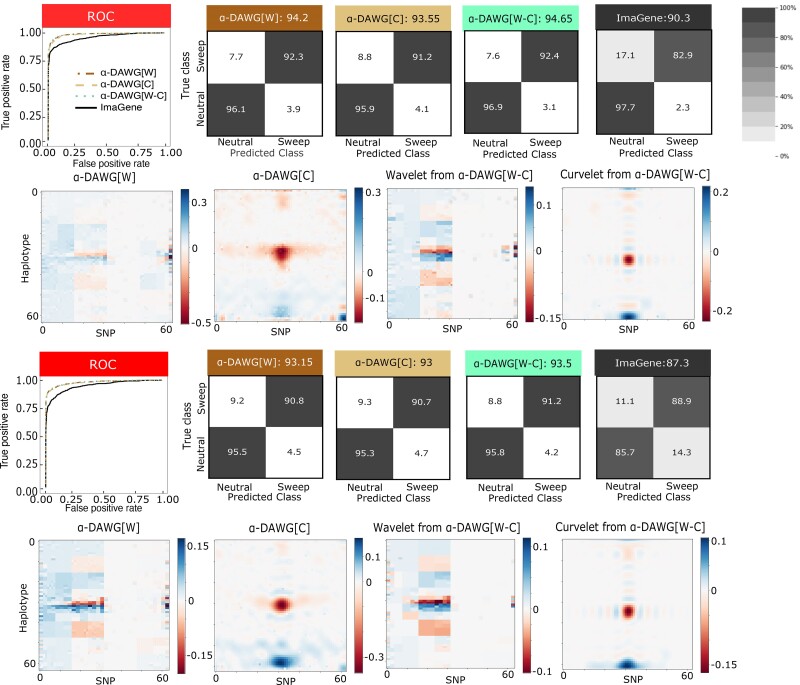
Fig. 2.
Performances of the three linear α-DAWG models and ImaGene applied to the Constant_1 (top two rows) and Constant_2 (bottom two rows) datasets that were simulated under a constant-size demographic history and 200 sampled haplotypes. The training and testing sets respectively consisted of 10,000 and 1,000 observations for each class (neutral and sweep). Sweeps were simulated by drawing per-generation selection coefficient and the frequency of beneficial mutation when it becomes selected , both uniformly at random on a scale. Moreover, the generations in the past in which the sweep fixed t was set as for the Constant_1 dataset and drawn uniformly at random as for the Constant_2 dataset. Model hyperparameters were optimized using 5-fold cross validation (Table 1) and ImaGene was trained for the number of epochs that obtained the smallest validation loss. The first and third rows from the top display the ROC curves for each classifier (first panel) as well as the confusion matrices and accuracies (in labels after colons) for the four classifiers (second to fifth panel). The second and fourth rows from the top display the two-dimensional representations of regression coefficient functions reconstructed from wavelets or curvelets for α-DAWG[W] (first panel), α-DAWG[C] (second panel), and α-DAWG[W-C] (third and fourth panels). Cells within confusion matrices with darker shades of gray indicate that classes in associated columns are predicted at higher percentages. The white color at the center of the color bar associated with a β function represents little to no emphasis placed by linear α-DAWG models, whereas the dark blue and dark red colors signify a positive and negative emphasis, respectively.

