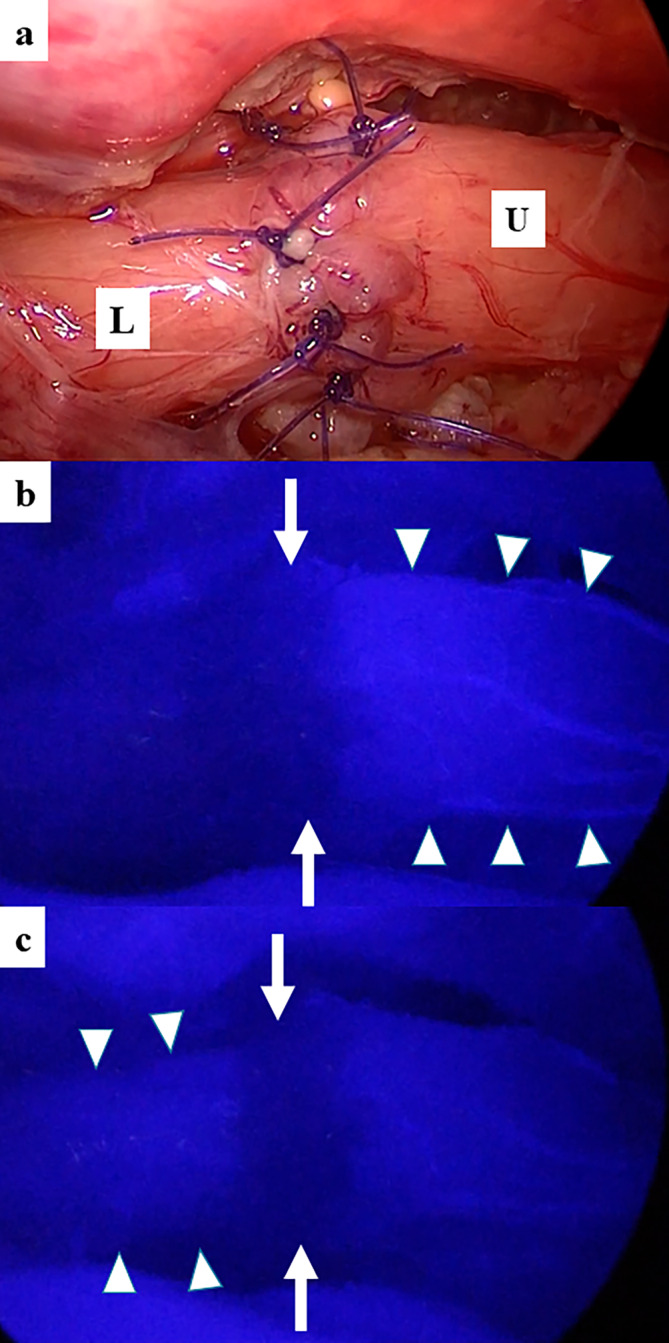
FIGURE 2.

Intraoperative ICG fluorescence findings. (a) At the end of esophageal anastomosis. U, the upper esophagus; L, the lower esophagus. (b) At 25 s after ICG was injected intravenously. Arrow, the anastomotic site; Arrowhead, the upper esophagus. (c) At 30 s after ICG was injected intravenously. Arrow, the anastomotic site; Arrowhead, the lower esophagus.
