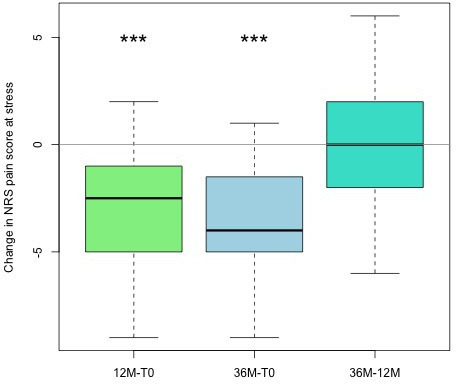
Fig. 4.

Changes in numerical rating scale (NRS) of the operated hand at stress, with boxplot showing the differences comparing two timepoints: baseline (T0), with follow-up at 12 months and at 36 months, and changes between months 12 and 36. *p < 0.05, **p < 0.005, ***p < 0.001; Wilcoxon test.
