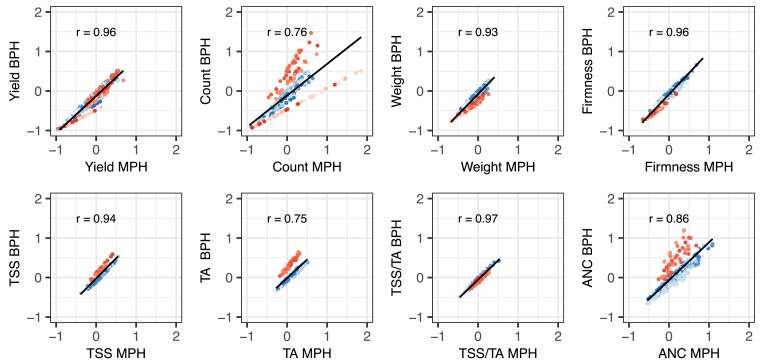
Fig. 4.
Correlations (r) between mid-parent heterosis (MPH) and best-parent heterosis (BPH) for fruit yield, count, weight, firmness, TSS, TA, TSS/TA, and ANC among strawberry hybrids () grown in Salinas, California field experiments in 2017–2018 and 2018–2019. H was estimated from a genome-wide sample of 28,513 SNPs genotyped with a 50K Axiom array. MPH ratios were estimated by , where , is the EMM for one parent, is the EMM for the other parent, and is the EMM for the hybrid. BPH ratios were estimated by , where is the EMM for the best-parent. The best parent for an hybrid (blue circles) was the parent with the largest EMM, whereas the best parent for an elite × exotic hybrid (red circles) was the elite parent. The shades of blue identify hybrids () within different full-sib families, whereas the shades of red identify hybrids () within different elite × exotic full-sib families. The solid blank lines are predicted values from linear regressions of BPH ratio on MPH ratio.

