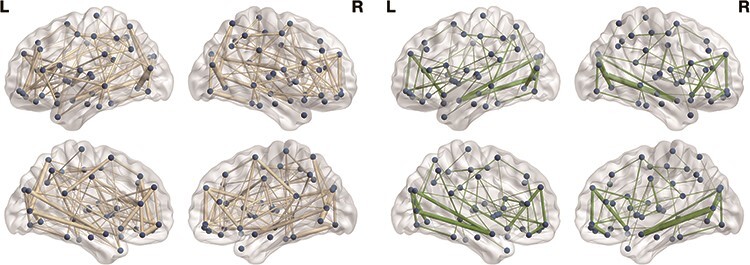
Figure 2.

Visual representation of the white matter connectome at age 15 years. The left side represents individuals with greater mother–child closeness, characterized by high global efficiency and transitivity, while the right side represents those with less mother–child closeness, characterized by low global efficiency and transitivity. The circles represent nodes located in different brain regions, including frontal lateral, frontal medial, orbitofrontal, temporal, limbic, subcortical, parietal, and occipital. The lines represent the edges, which denote structural connectivity between brain regions.
