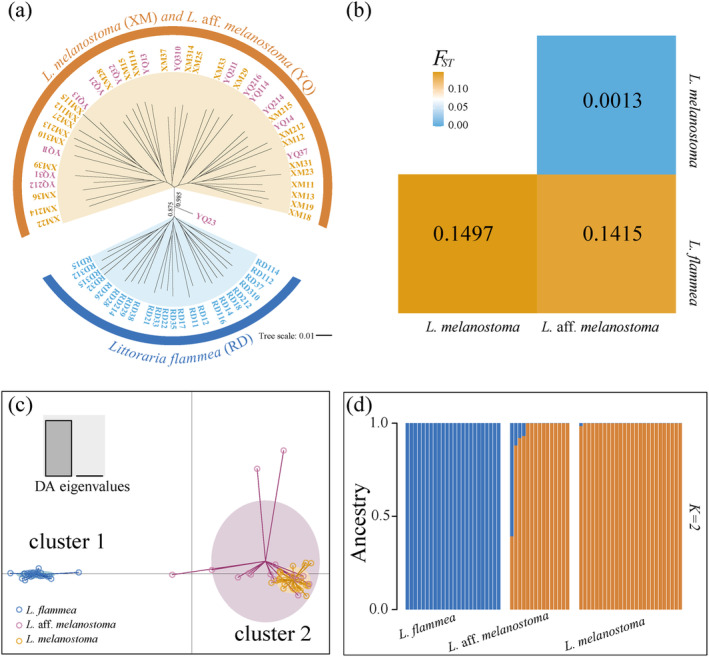
FIGURE 3.

Phylogenetic relationships of three snail species. (a) The phylogenetic maximum likelihood (ML) tree depicts the relationships among three species: L. flammea (RD), L. aff. melanostoma (YQ), and L. melanostoma (XM). The support values on the branches are based on 1000 bootstrap replicates. (b) Pairwise values of F ST based on neutral SNPs. (c) Discriminant analysis of principal components (DAPC) for the neutral SNPs. The axes are the first two linear discriminants or DA eigenvalues (901.920 and 3.274, respectively). Each point on the plot represents an individual snail. The analysis revealed two clusters: Cluster 1 consists of L. flammea individuals and cluster 2 includes L. aff. melanostoma and L. melanostoma individuals. (d) Bar graph of ADMIXTURE analysis. The bars represent the proportions of each individual's genetic ancestry from the two ancestral populations (i.e., blue and orange colors represent different ancestral populations).
