Figure 1.
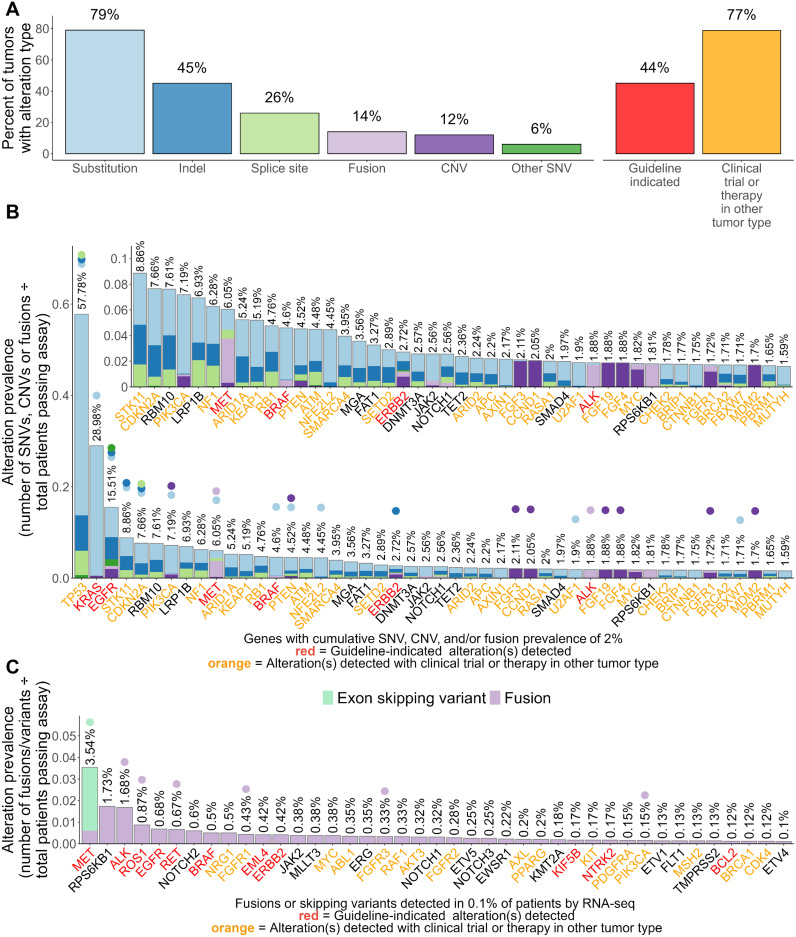
Landscape of genomic alterations detected by TSO 500 in 7,606 NSCLC tumors. (A) Overall prevalence of alteration types detected including clinically informative alterations. (B) Gene-level summarized prevalence of detected genomic alterations. (C) Gene-level summarized prevalence of fusions and exon skipping mutations detected via RNA components of the TSO 500 assay. For (B, C), the Y-axis shows the prevalence of alterations, which are visualized via a stacked bar plot and summarized at the gene level. Prevalence was calculated by dividing the number of patient tumors with detected SNVs, CNVs, or fusions/skipping variants by the total number of patient specimens that passed the corresponding assay component. Percentages on top of each stacked bar represent the cumulative prevalence of all alterations for a gene. Points were placed above percentages to note what genomic alterations within each gene had significantly different prevalences between adenocarcinoma and squamous cell carcinoma. The X-axis shows genes whose combined alterations were detected in ≥2% (B) or ≥0.1% (C) of patient tumors. Genes are sorted based on their combined alteration prevalence in patient tumors. Gene names are colored red or orange if a guideline-indicated alteration or alteration matched to a clinical trial or therapy in another tumor type was detected within the gene for one or more patient tumors. A zoomed-in panel within the main stacked bar plot of (B) shows the prevalence of alterations for genes whose cumulative alteration prevalence was <10%.

