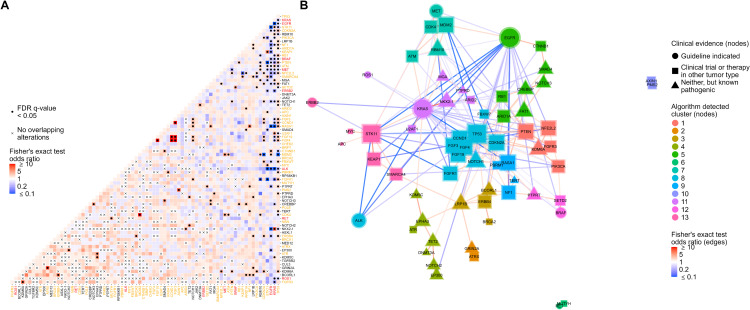
Figure 3.
Co-occurrence analysis followed by network analysis with gene module detection to assess co-occurrences and mutual exclusivities between genomic alterations in NSCLC. (A) Co-occurrence or mutual exclusivity of genomic alterations were assessed at the gene level using pairwise Fisher’s exact tests and visualized via heatmap where red cells indicate co-occurrence (Fisher’s exact test odds ratio > 1), and blue cells represent mutual exclusivity (odds ratio < 1). Cells marked with a dot indicate co-occurrences/mutual exclusivities that reached significance (multiple testing corrected false discovery rate q-value < 0.05). Cells marked with an “x” indicate complete mutual exclusivity (i.e., no alterations were found in the same tumor for those genes). Only genes with alterations detected in at least 1% of patient tumors were included in the analysis. Gene names are colored red or orange if a guideline-indicated alteration or alteration matched to a clinical trial or therapy in another tumor type was detected within the gene for one or more patient tumors. (B) Odds ratios of significant co-occurrences/mutual exclusivities were extracted and used to construct a gene network where red and blue connecting lines denote a co-occurring or mutually exclusive association, respectively. The shape of nodes in the network relates to the highest clinical evidence of genomic alterations detected in each gene and each node is sized based on the number and strength of its connections. A community detection algorithm was used to detect gene modules within the network, and each node was colored based on its module membership. Nodes in the networks were positioned using the force-directed algorithm ForceAtlas2.

