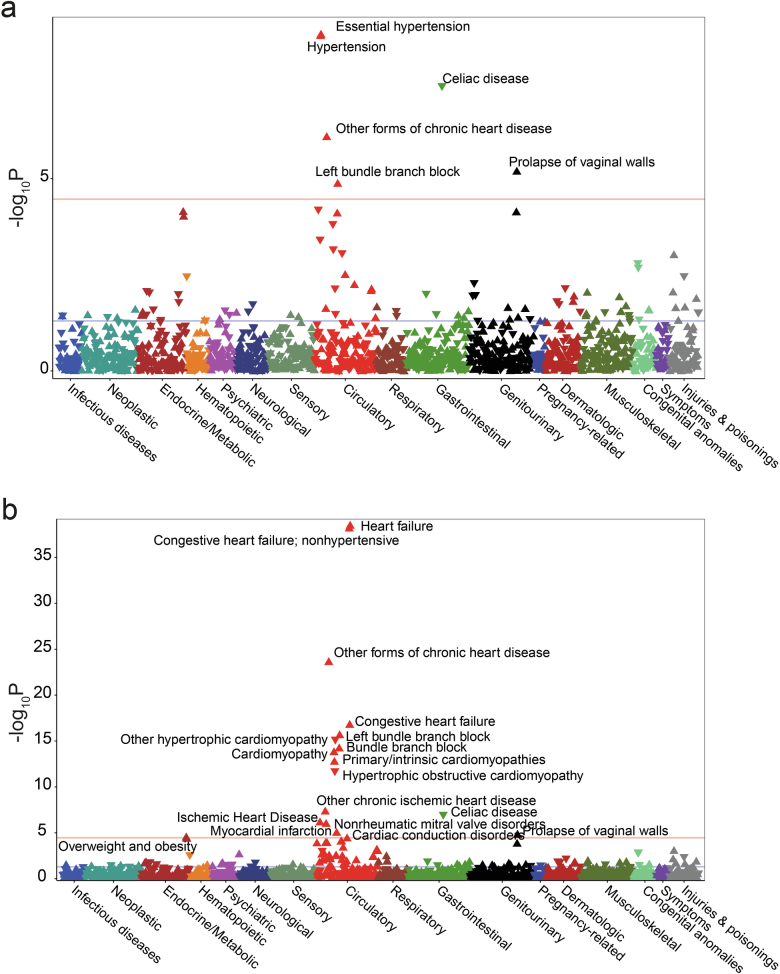
Extended Data Fig. 8. DCM-PGS pheWAS adjusted for DCM/heart failure, and hypertension.
Manhattan plot of DCM-PGS associations after adjusting for DCM or heart failure (a), and hypertension (b) status in UK Biobank. Additional co-variates included in the linear regression model include sex, age, age2, and first ten principal components. ICD-9 and ICD-10 diagnostic codes are mapped to Phecode Map version 1.2. Mapped phenotypes exceeding phenome-wide significance threshold (P 2.7 × 10⁻⁵, red line, adjusted for the total number of tested phenotypes) are labelled. Blue line indicates nominal significance (P < 0.05). Direction of triangle indicates the direction of effect of the PGS association. P-values are two-sided and calculated from linear regression model, and not adjusted for multiple testing.

