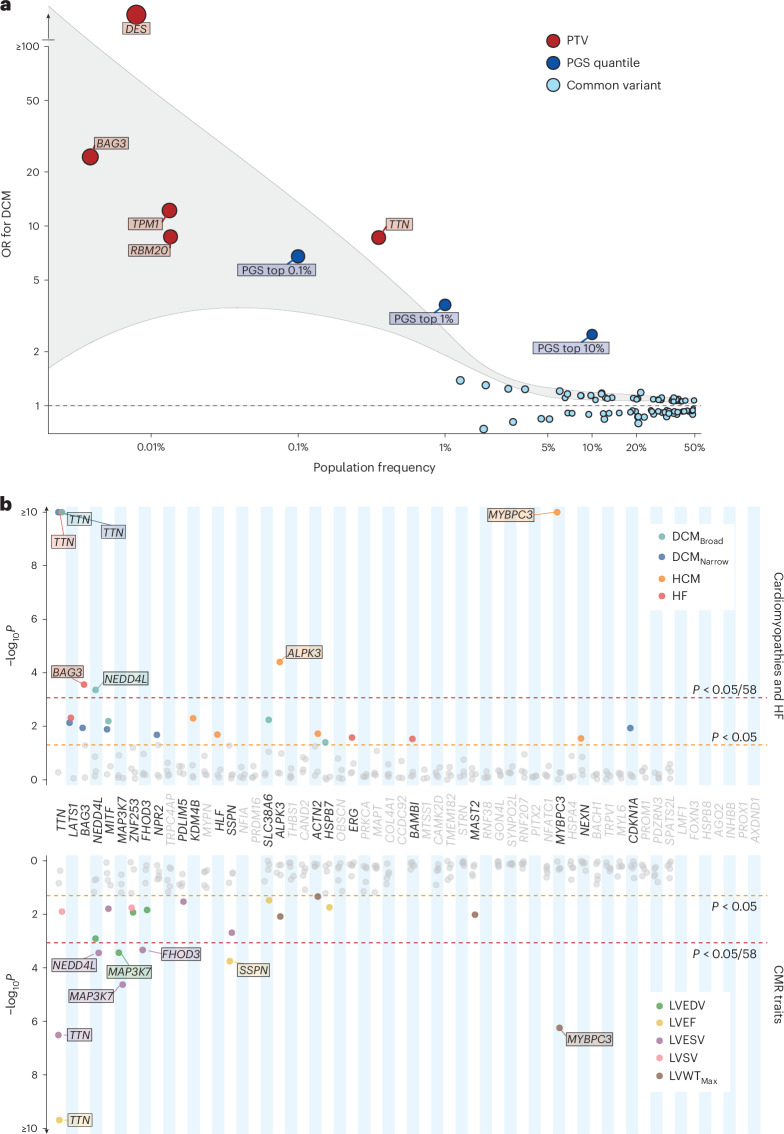
Fig. 4. Rare variant analysis highlights the genomic architecture of DCM and identifies novel disease- and trait-associated genes.
a, Genomic architecture of DCM incorporating effects arising from individual sentinel common variants (MAF > 0.01) in DCM loci (light blue), upper PGS quantiles of common variants (dark blue) and cumulative burden testing of rare PTVs (MAF < 0.001) in genes with moderate or definitive evidence of causing DCM30 (red). Population frequency represents MAF for individual sentinel variants, the proportion of the population contained within the quantile for PGS, and the cumulative population frequency of rare variants in burden-tested genes. Outcome for burden testing was DCM, with presentation of all genes reaching nominal significance (P < 0.05) following logistic ridge regression with Firth correction implemented using REGENIE. The gray highlighted region indicates smoothened regression lines of the upper and lower bounds for each effect estimate. b, Burden analysis of rare PTVs (MAF < 0.001) in 58 prioritized protein-coding genes in UKB (453,455 participants with whole-exome sequencing, and 36,104 with CMR), highlighting established Mendelian cardiomyopathy genes (TTN, BAG3, FHOD3, ALPK3 and MYBPC3) and three novel genes (NEDD4L, MAP3K7 and SSPN). Red line indicates statistical significance (P < 8.6 × 10⁻⁴; 0.05 of 58 genes), and orange line indicates nominal significance (P < 0.05). Genes are ordered by mean P value across all tested traits, from lowest to highest, with genes reaching nominal significance (P < 0.05) for at least one trait highlighted in bold. Burden testing was performed using logistic ridge regression with Firth correction implemented using REGENIE. Detailed results are available in Supplementary Tables 11–13. HF, heart failure; LVSV, LV stroke volume; LVWTMax, maximum LV wall thickness.

