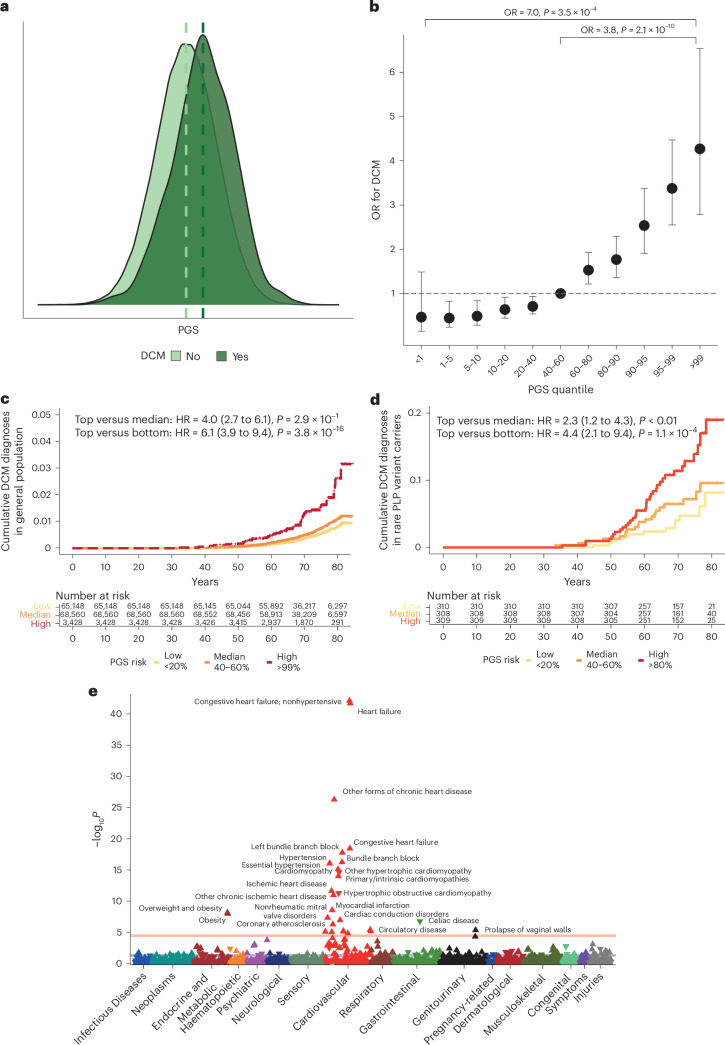
Fig. 6. DCM PGS is associated with DCM disease status in the UKB, including in carriers of pathogenic or likely pathogenic variants in DCM-causing genes.
a, PGS distribution among 347,585 UKB participants with and without DCM, showing higher PGS in those with DCM. b, ORs and 95% confidence intervals for DCM in quantile bins among 347,585 UKB participants, comparing individuals in the top centile (n = 3,428) with those in the median 40–60% centiles (n = 68,560) and lowest centile (n = 3,428). P values are two-sided and were calculated from a logistic regression model and not adjusted for multiple testing. c, Cumulative hazards for lifetime diagnosis of DCM in the UKB stratified by high (top 1%, red), median (middle 20%, orange) and low (bottom 20%, yellow) PGS. P values are two-sided and were calculated from a Cox proportional hazards regression model and not adjusted for multiple testing. d, Cumulative hazards for lifetime diagnosis of DCM in carriers of pathogenic or likely pathogenic (PLP) rare variants in DCM-causing genes in UKB, stratified by high (top 20%, red), median (middle 20%, orange) and low (bottom 20%, yellow) PGS. P values are two-sided and were calculated from a Cox proportional hazards regression model and not adjusted for multiple testing. e, Manhattan plot of DCM PGS pheWAS in UKB, showing associations with cardiovascular phenotypes and obesity. ICD-9 and ICD-10 diagnostic codes are mapped to PheCode Map v.1.2. Mapped phenotypes exceeding the phenome-wide significance threshold (P = 2.7 × 10⁻⁵, red line, adjusted for the total number of tested phenotypes) are labeled. The blue line indicates the nominal significance level (P < 0.05). The direction of the triangle indicates the direction of effect of the PGS association. P values are two-sided and were calculated from the linear regression model and not adjusted for multiple testing. PheWAS analyses adjusted for DCM or heart failure and hypertension status are shown in Extended Data Fig. 8. HR, hazard ratio.

