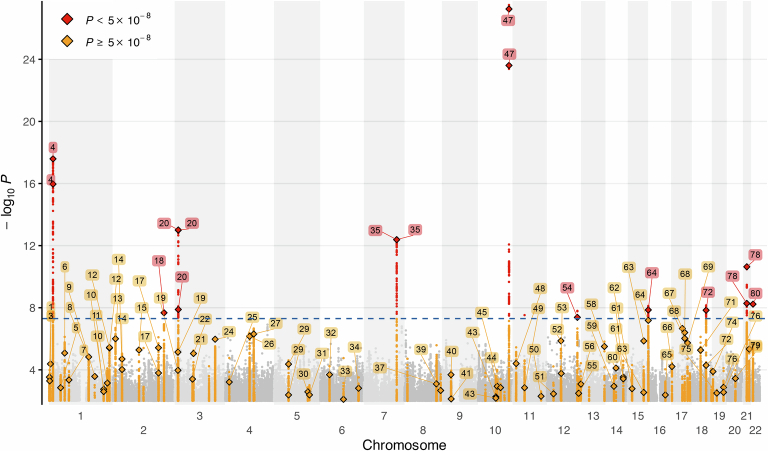
Extended Data Fig. 2. Manhattan plot of DCMNarrow GWAS.
Manhattan plot of GWAS of 6,001 strictly defined DCM cases and 449,384 controls (DCMNarrow GWAS). GWAS was performed using the same methods as for DCM GWAS using the subset of studies that recruited participants from specialist clinical cohorts or using unequivocal DCM diagnostic codes (Supplementary Information 1). DCM diagnosis required cardiac imaging, clinical expertise and/or robustly-defined ICD codes. The 80 loci identified from DCM GWAS and DCM MTAG (Fig. 2) are labelled. In total there were 10 loci reaching genome-wide significance (dashed blue line – P < 5 × 10⁻⁸), all of which were significant in the primary GWAS. P-values were two-sided and based on inverse-variance weighted fixed-effects model, and not adjusted for multiple testing.

