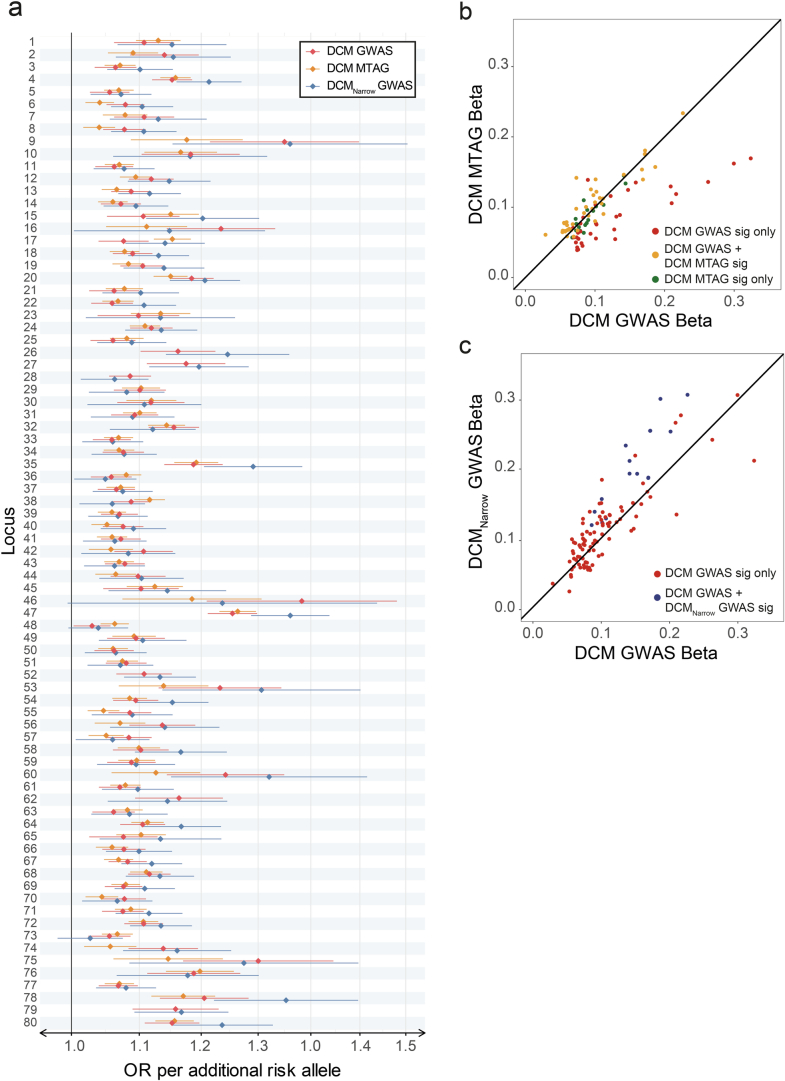
Extended Data Fig. 3. Comparison of effect sizes across DCM GWAS, DCM MTAG, and DCMNarrow GWAS.
a, Forest plot of effect size across DCM GWAS, DCM MTAG and DCMNarrow GWAS for all 80 genomic risk loci identified in DCM GWAS and DCM MTAG. Effect estimates are derived from DCM GWAS of 12,556 cases and 1,199,156 controls (red), DCM MTAG consisting of the DCM GWAS cohort and 36,203 participants with cardiac magnetic resonance derived quantitative cardiac traits (orange), and DCMNarrow GWAS of 6,001 cases and 449,382 controls (blue). All sentinel variants at the 80 genomic risk loci identified in this study are presented (62 from DCM GWAS using FDR threshold 1% and 54 from DCM MTAG at genome-wide significance). The central effect estimate is represented with a diamond and the tails represent the 95% confidence interval. b, Scatter plot comparing absolute effect sizes for conditionally independent variants in DCM GWAS and DCMNarrow GWAS. c, Scatter plot comparing absolute effect sizes for conditionally independent variants in DCM GWAS and DCM MTAG. Variants tended to have a greater effect in DCMNarrow GWAS than in DCM GWAS, particularly for variants that were genome-wide significant in DCMNarrow GWAS (blue) compared with those that were only FDR significant in DCM GWAS (red). When comparing DCM GWAS and DCM MTAG, variants that were FDR significant in DCM GWAS and genome-wide significant in DCM MTAG (dark green), and that were genome-wide significant only in DCM MTAG (yellow), had similar effect sizes, while variants that were only FDR significant in DCM GWAS (red) tended to have larger effects in DCM GWAS than in DCM MTAG.

