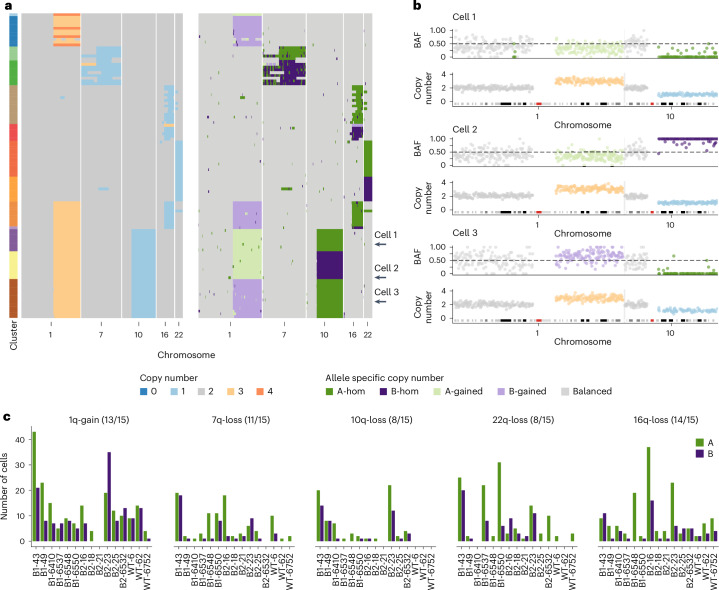
Fig. 3. Allele-specific inference reveals the convergence of CNAs.
a, Total copy number heatmap and allele-specific copy number heatmap for B2-23 for chromosomes 1, 7, 19, 16 and 22. Cells are grouped into unique alterations based on allele-specific copy number. Total number of cells = 111. b, Three cells from the heatmap with chr1q gain and chr10q loss. For each cell, the BAF and copy number are shown for chromosomes 1 and 10. These three cells have distinct combinations of chr1-gain and 10 loss. Dashed line in BAF plots shows BAF = 0.5, colors in copy number and BAF plots are shown in the ‘’Copy number’ and ‘Allele specific copy number’ color legends, respectively. c, Number of cells with either allele A or B gained/lost across the six most common alterations in 15 donors. Title above each plot shows the event and the number of samples that have events on both alleles. Colors denote the allele lost or gained (green for A allele and purple for B allele). BAF, B allele frequency.

