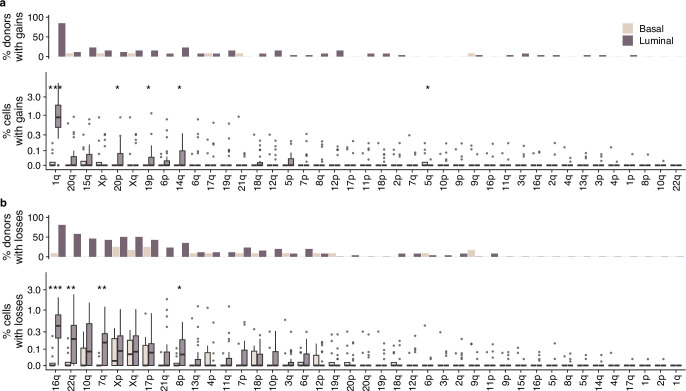
Extended Data Fig. 2. Prevalence of arm alterations per cell type.
a, Top: percentage of donors that have >1 cell with chromosome arm gained per cell type. Bottom: percentage of cells with gains per cell type (n = 12 basal samples, n = 26 luminal samples), each data point is a donor. b, Top: percentage of donors that have >1 cell with chromosome arm lost per cell type. Bottom: percentage of cells with losses per cell type (n = 12 basal samples, n = 26 luminal samples); each data point is a donor. Stars indicate p-values from two-sided Wilcoxon rank-sum test: ***p < 0.001, **p < 0.01, *p < 0.05. When no star is shown above comparisons, differences are not significant (p > 0). Box plots indicate the median, first and third quartiles (hinges) and the most extreme data points no farther than 1.5× the IQR from the hinge (whiskers). No adjustments for multiple comparisons were performed.

