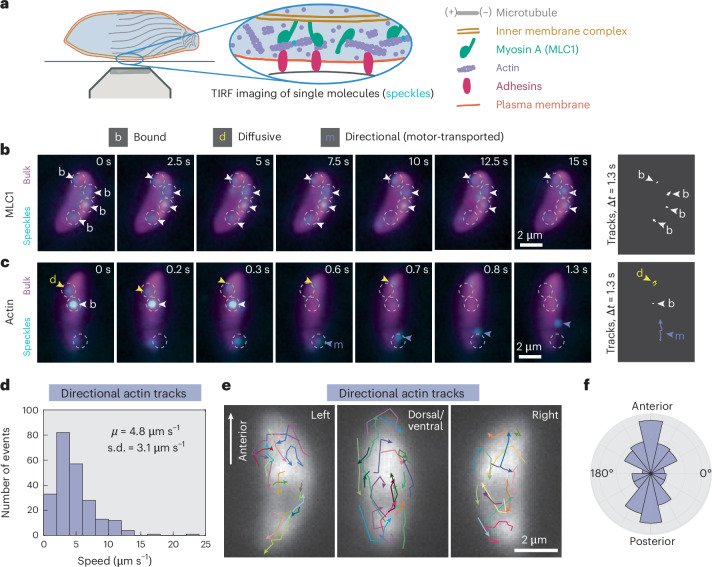
Fig. 1. Toxoplasma gondii actin transport direction is heterogeneous, not uniformly rearward.
a, Schematic of the intermembrane actomyosin layer that drives apicomplexan gliding and of TIRF imaging of speckle-labelled actin or MLC1. Inset: actin is speckle-labelled with single Janelia Fluor dyes (cyan). b,c, Examples of MLC1 (b) and actin (c) movement (speckles; cyan) over time in extracellular parasites, with higher-density labelling (bulk; magenta) to show cell position. Arrowheads highlight examples of specific protein behaviours. Images denoised with noise2void60. Protein trajectories (far right) are shown for an equal time interval (1.3 s) to allow comparison of bound (white), diffusive (yellow) and directional (purple) movements. Experiment repeated in n = 7 (MLC1) and n = 18 (actin) independent cells. d, Histogram of speeds of directional actin tracks from 18 cells. μ, mean; s.d., standard deviation. e, Directional actin tracks (n = 54 tracks in 18 overlaid cells from three experiments). Cells were grouped by the cell side visible, aligned with anterior end up and superimposed. Cell polarity was determined by microtubule labelling or tracking of the posterior end following posterior-down cell twirling (Supplementary Information Section 5), and directional actin tracks were aligned with respect to the parasite long axis. f, Polar histogram of the orientation of directional actin displacements with respect to cell polarity (n = 231 displacements, 54 tracks, 18 cells).

