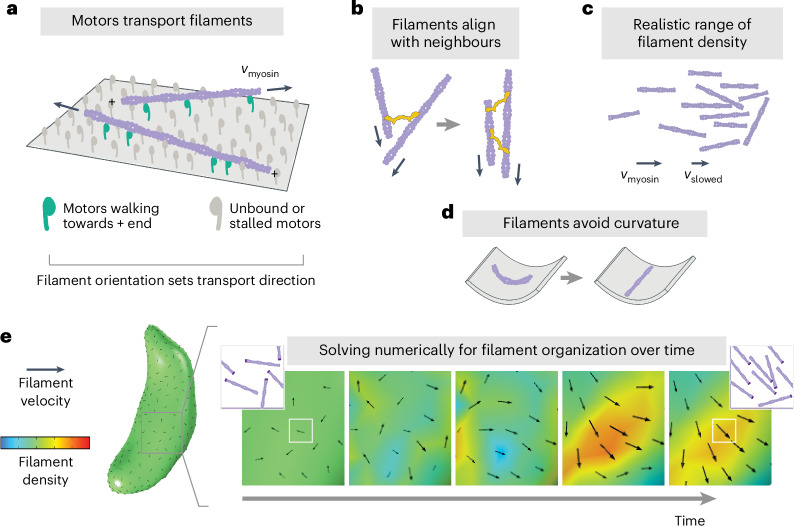
Fig. 2. Toxoplasma actin self-organization: theoretical model.
Rules of local actin filament behaviour, implemented in equation (2): a, Actin filaments (purple) are transported with their minus ends leading at speed vmyosin, as indicated by arrows. b, Neighbouring filaments align by steric effects or crosslinking proteins (yellow). c, Filament density remains within a realistic range, with filament speed slowing if entering a pile-up. d, Filament orientation is biased towards lower curvature. e, Example of numerically solving for filament self-organization using the finite element method, predicting filament density and velocity over time. Black arrow size reflects velocity magnitude. To provide intuition, for each white box, the corresponding inset shows schematized F-actin (darker purple represents minus ends) whose density and orientation are consistent with the simulation density (colour) and velocity (black arrow).

