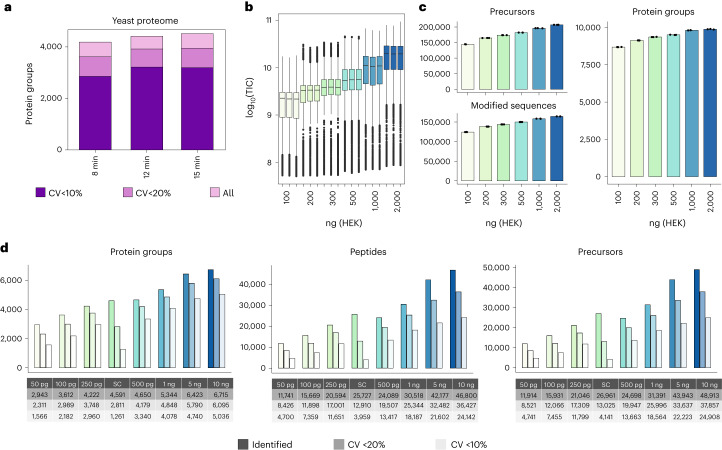
Fig. 2. Deep single-shot proteome coverage from high to low sample loads.
a, Protein groups identified and quantified below 10% and 20% of CV (n = 3) in a yeast extract using different chromatographic gradient lengths. b, Boxplot of total ion current (in log10 scale) measured in a dilution series (from 100 to 2,000 ng) of a HEK293 cell protein digest. c, Protein groups, precursors and modified peptides identified (n = 3) in a dilution series of HEK293 cell peptide extract using Spectronaut (v.17). d, Protein groups, peptides and precursors identified in three replicates in a low-amount dilution series and 12 single HeLa cells (SC) individually using Spectronaut (v.18). Next to each bar, the number of each quantified with CV < 20% and CV < 10%. Box limits indicate the 25th and 75th percentiles as determined by R software; whiskers extend 1.5 times the interquartile range from the 25th and 75th percentiles; outliers are represented by dots. TIC, total ion chromatogram.

