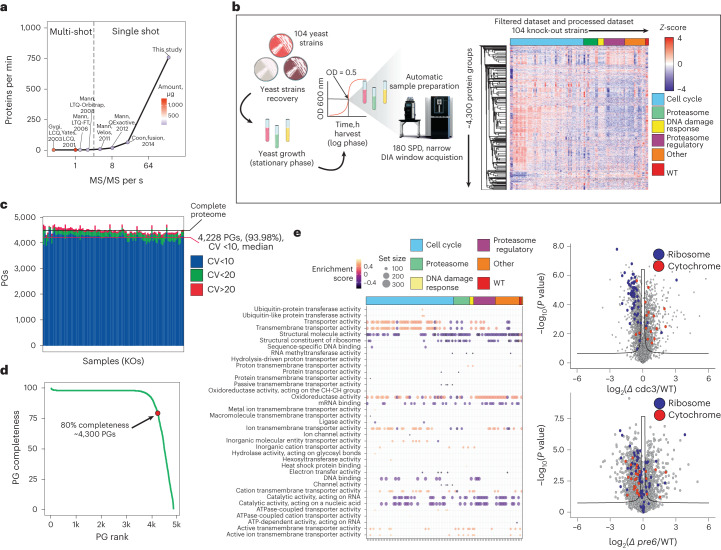
Fig. 5. Functional genomics screen by comprehensive yeast proteome profiling.
a, Rate of protein identifications as a function of mass spectrometer MS/MS scan rate for large-scale yeast proteome analysis (Yates, 2001 (ref. 53); Gygi, 2003 (ref. 52); Mann, 2006 (ref. 35); Mann, 2008 (ref. 22); Mann, 2011 (ref. 54); Mann, 2012 (ref. 55); Coon, 2014 (ref. 23)). b, Experimental setup for high-throughput yeast proteome MS analysis and dataset description. c, Protein identification numbers (mean) and CV per sample (n = 3). d, Data completeness curve showing the number of proteins quantified in a given percentage of samples. e, GSEA functional enrichment analysis results using GO molecular function terms gene set. Size of the dot indicates the set size and the color the normalized enrichment score (NES) (left). Volcano plot of differentially expressed proteins between the selected knockouts and a reference strain (right). P values were obtained by two-sided t-test and BH FDR corrected. BH, Benjamini–Hochberg; KO, knockout ; PG, protein group; WT, wild type.

