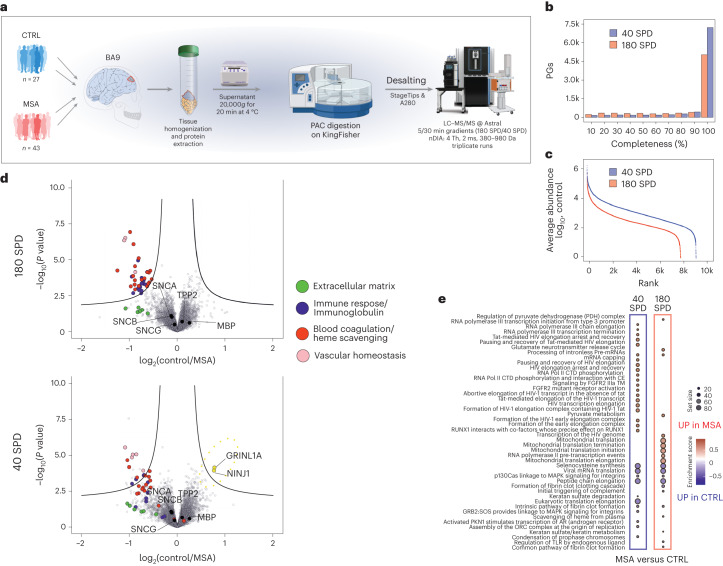
Fig. 6. Enhanced high-throughput clinical proteomics.
a, Sample preparation workflow of Broadmann’s area 9 (BA9) biopsies excised from either normal or MSA patient brains for proteome MS analysis. b, Histogram of data completeness showing the number of proteins quantified in a given percentage of samples for 180-SPD and 40-SPD methods. c, log10 abundance dynamic range detected by 180-SPD and 40-SPD methods. d, Volcano plots showing differential expression results between control and case samples (P values were obtained by two-sided t-test and BH FDR corrected) for both methods. e, GSEA functional enrichment analysis results using molecular pathways from the Reactome database. The top and bottom ten enriched molecular pathways for each method are shown. Size of the dot indicates the set size and the color the NES. PAC, protein aggregation capture.

