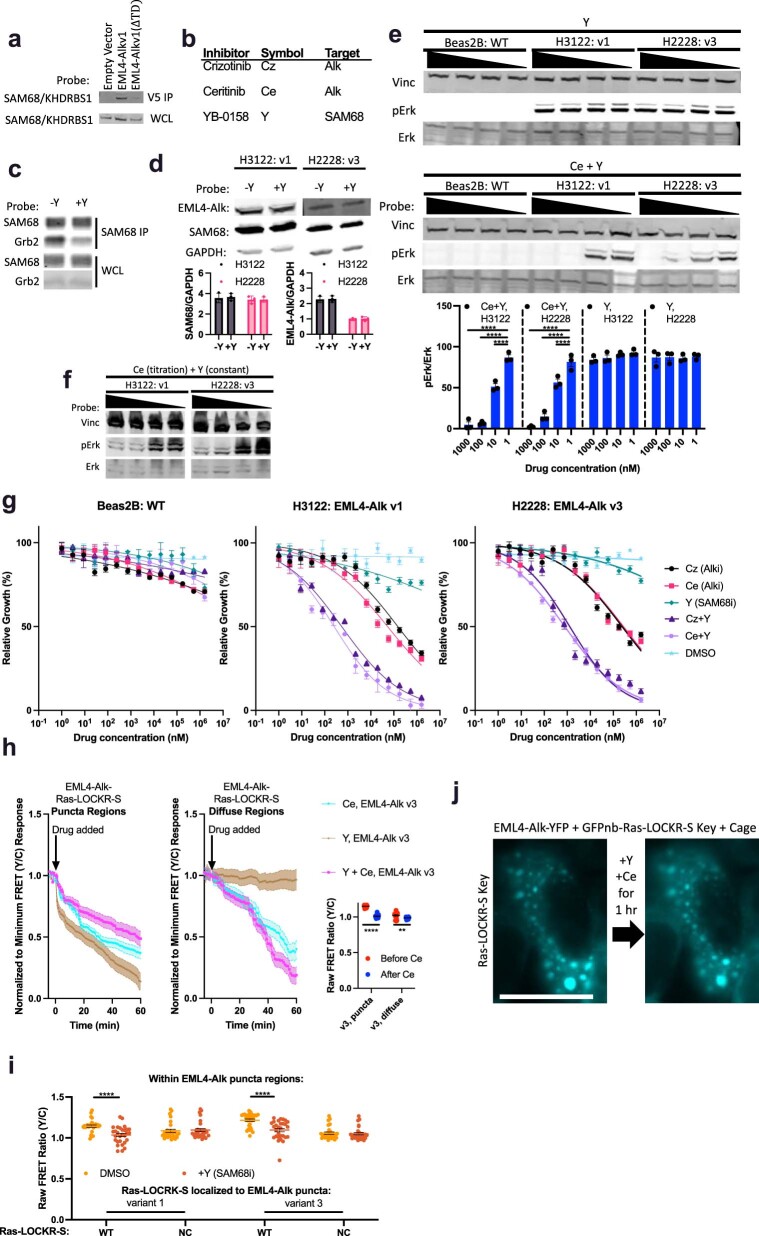
Extended Data Fig. 7. SAM68 regulates Ras signaling inside EML4-Alk granules.
a, Representative immunoblot from 3 biologically independent experiments of Beas2B cells transfected with V5-tagged EML4-Alk v1 full length or with trimerization domain deleted (∆TD), subjected to V5 immunoprecipitation, and probed for SAM68. The EML4-Alk pulldowns and whole cell lysate levels are the same as Extended Data Fig. 6b. b, List of inhibitors used, their abbreviations, and their target. c, Representative immunoblot from 3 biologically independent experiments of Beas2B cells treated with 1 μM YB-0158 for 1 h, underwent Sam68 immunoprecipitation for some of the sample, and probed for Sam68 and Grb2. Top: Sam68 immunoprecipitation. Bottom: whole cell lysate. d, H3122 or H2228 cells were treated with 1 μM YB-0158 for 24 h and probed for Alk (EML4-Alk) and SAM68. Top: Representative immunoblot. Bottom: densitometry analysis (n = 3 experiments). e, (top) Representative immunoblot of Beas2B, H3122, and H2228 cells treated for 1 h with varying concentration of Ceritinib (1nM-1μM) and YB-0158 (1nM-1μM). (bottom) Relative phosphorylated Erk over total Erk quantified (n = 3 experiments per condition). Statistics for e from left to right: ****p = 7.3 × 10⁻⁵, ***p = 0.00072, **p = 0.0043, **p = 0.0047, two-way student t-test. f, Representative immunoblot from 3 biologically independent experiments of H3122 and H2228 cells treated for 1 h with either constant concentration of YB-0158 (200 nM) and a range of concentrations of Ceritinib (1nM-1μM) (left) or a constant concentration of Ceritinib (200 nM) and a range of concentrations of YB-0158 (1nM-1μM) (right). g, Cell counts of Beas2B, H3122, H2228 cell lines incubated for 1 week with varying concentrations of inhibitors to Alk and/or SAM68 (n = 3 experiments per condition), or DMSO. h, (left) Normalized to minimum FRET ratio time-courses of Beas2B cells transfected with Ras-LOCKR-S localized to EML4-Alk v3 and incubated with 1 μM of inhibitors (n = 10 cells per condition). Puncta and diffuse regions were analyzed separately. Normalized to minimum FRET ratios are calculated by normalizing the data set to the condition with the largest decrease in FRET ratios (Ce + Y in both cases) where 0 represents the lowest FRET ratio out of the entire data set. (right) Raw FRET ratios of puncta and diffuse EML4-Alk regions after Alk inhibition for 1 h (n = 21 cells per condition). Statistics: puncta: ****p = 1.5 × 10⁻²², diffuse: **p = 0.0025. i, Average raw FRET ratios in the punctate regions of Beas2B cells expressing Ras-LOCKR-S WT or NC sensor fused to EML4-Alk v1. Cells were treated with either DMSO or 1 μM YB-0158 for 1 h (n = 29 cells per condition). Statistics: v1: ****p = 1.7 × 10⁻³², v3: ****p = 6.8 × 10⁻¹³. j, Representative epifluorescence images from 3 biologically independent experiments of Beas2B cells expressing YFP-tagged EML4-Alk v1, GFPnb-Ras-LOCKR-S Key, and Cage. CFP channel is shown indicating localization of Ras-LOCKR-S Key. These cells were incubated with 1 μM YB-0158 and 1 μM Ceritinib for 1 h. Solid lines in g indicate IC50 fit with points representing average normalized cell count. Solid lines in h indicate representative average time with error bars representing standard error mean (s.e.m.). Bar graphs represent mean ± s.e.m. ****p < 0.0001, **p < 0.01 ordinary two-way ANOVA comparing to cells treated with DMSO. Scale bars = 10 μm.

