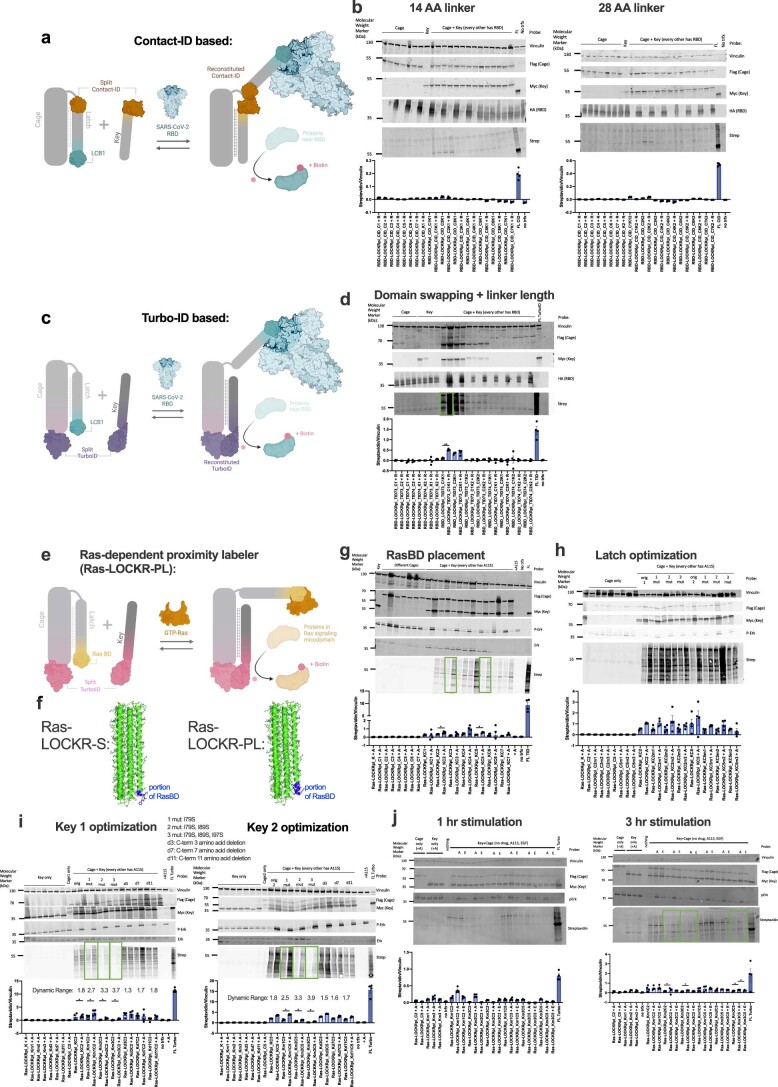
Extended Data Fig. 3. Development of Ras-LOCKR-PL.
a, b, Split ContactID-based LOCKR proximity labelers were tested using similar architecture to lucCageRBD. Schematic in a and data shown in b. Different grafting positions of the smaller bit of ContactID on the latch using Rosetta-based GraftSwitchMover (see Methods) and different linker lengths between larger bit of ContactID and Key were tested in 293T cells transfected with Flag-tagged Cage, Myc-tagged Key, full length ContactID (FL CID), and HA-tagged RBD (receptor binding domain of SARS-CoV-2 spike protein) with 5x nuclear exclusion sequence. After 16 h of 500 μM biotin incubation, these cells were subsequently western blotted for the transfected proteins and biotinylation via streptavidin (n = 4 biologically independent experiments per condition). c, d, 293T cells were transfected with Split TurboID (split site TurboID73/74)-based LOCKR Cages, Keys, or Keys with Cages, which were coexpressed with or without RBD, and biotinylation levels were probed following lysis. Biotinylation levels of cells expressing full length TurboID (FL TID) are also shown. Different placements of the split TurboID and linker lengths between split TurboID and Cage/Key were tested with the Ras-LOCKR-PL candidate that led to the highest increase in biotinylation upon RBD expression boxed in green and optimized further (n = 4 biologically independent experiments per condition). Statistics: **p = 0.0058. Schematic in c and data shown in d. e–j, Testing of Ras-LOCKR-PL candidates was done via western blotting of CIAR-PM-299 cells incubated with 250 nM A115 (labeled A) or 100 ng/mL EGF (labeled E) and 500 μM biotin for either 16 hour (g-i), 1 h (j, left), or 3 h (j, right) (n = 4 biologically independent experiments per condition). RasBD was grafted onto the latch using GraftSwitchMover (f, shows structure predictions) and tested for increases in biotinylation after Ras activation by A115 (FL = full length TurboID) (n = 4 biologically independent experiments per condition). The highest dynamic range Ras-LOCKR-PL candidates are boxed in green (g) and were further optimized by either weakening latch:cage interaction by mutating latch (h) or weakening key:cage interaction by mutating the Key (2 different Cages tested for left and right) (i) (n = 4 biologically independent experiments per condition). Statistics for g from left to right: *p = 0.032, *p = 0.025. C-terminal Key truncations were also tested to weaken key:cage interaction (i) (n = 4 biologically independent experiments per condition). Statistics for i from left to right: *p = 0.042, *p = 0.015, *p = 0.032, *p = 0.044, *p = 0.017, *p = 0.023, *p = 0.027. The highest dynamic range Ras-LOCKR-PL candidates boxed in green (i) were tested in CIAR-PM-293 cells treated for shorter times with A115 or EGF (j) (n = 4 biologically independent experiments per condition). Statistics for j from left to right: *p = 0.021, *p = 0.036, *p = 0.048, *p = 0.018. See Supplementary Table 2 for domain structures and sequences. Bar graphs represent mean ± s.e.m. All statistics are derived from a two-way student t-test.

