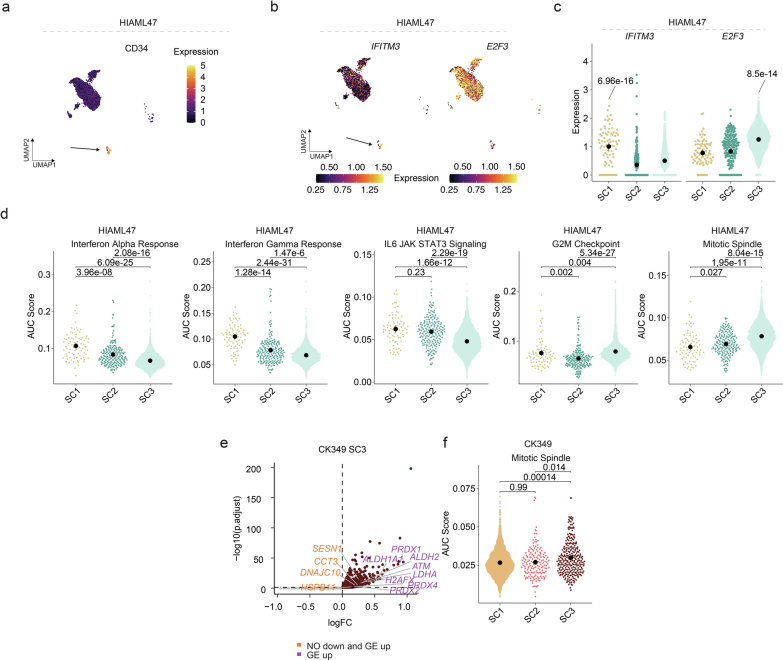
Extended Data Fig. 7. Molecular expression networks in HIAML47 and CK349.
a Cell surface expression of CD34 in single cells in HIAML47 plotted on the UMAP. Arrow indicates the pre-LSCs (SC1). b Expression of IFITM3 and E2F3 in single cells in HIAML47 plotted on the UMAP. Arrow indicates the pre-LSCs (SC1). c Expression of IFITM3 and E2F3 in the subclones in HIAML47 (n = 77 – 3,404 single cells). d Area Under the Curve (AUC) score for activity of indicated gene sets for each cell in the different subclones in HIAML47 (n = 77 – 3,404 single cells). e Upregulated genes in CK349-SC3. Orange labels highlight genes showing deregulation of cellular stress and DNA damage response based on nucleosome occupancy (NO) and gene expression (GE) and purple labels only based on gene expression. f AUC score for activity of Mitotic spindle gene set for each cell in the different subclones in CK349 (n = 162 – 2,553 single cells). In c-d and f, beeswarm plots show the 95% confidence interval for the mean, gene expression comparisons show the adjusted P-value from two-tailed pairwise Welch t-tests between subclones, and AUC scores were compared using two-tailed Wilcoxon test followed by Benjamini-Hochberg multiple correction testing. Expression levels of the individual genes in the score were calculated from normalized and variance stabilized counts.

