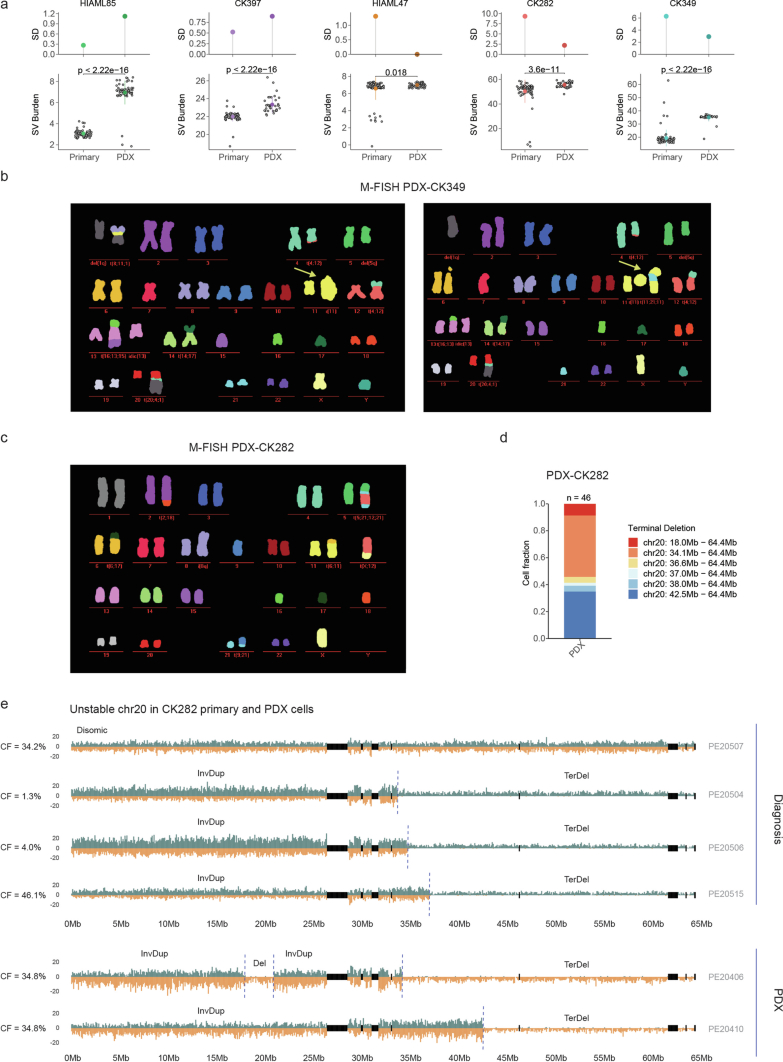
Extended Data Fig. 8. Clonal evolution of CK-AML in patient-derived xenografts.
a Karyotype heterogeneity between primary and patient-derived xenograft (PDX) cells based on structural variant burden (bottom) and its standard deviation (top). Each grey dot represents a single cell. The structural variant burdens were compared using two-tailed Wilcoxon test (HIAML85: Primary (n = 66) and PDX (n = 62); HIAML47: Primary (n = 91), and PDX (n = 54); CK282: Primary (n = 76) and PDX (n = 46); CK349: Primary (n = 91) and PDX (n = 40); CK397: Primary (n = 70) and PDX (n = 36)); Point ranges was defined by minima = mean - 2X standard deviation, maxima = mean + 2X standard deviation, point = mean. b Multiplex fluorescence in situ hybridization (M-FISH) of two representative engrafted cells from the secondary PDX of CK349. Arrows indicate the ring and linearized marker chromosomes. c M-FISH of a representative engrafted cell from the PDX of CK282. d Stacked barplot showing the cell fraction of different terminal deletions detected at chromosome 20 in the PDX of CK282. The number of cells assessed is indicated on top of the bar and the genomic positions of the terminal deletions are shown on the right. e Strand-specific read depth of representative single cells from CK282 and PDX-CK282 showing different rearrangements detected at chromosome 20. Reads denoting somatic structural variants, discovered using scTRIP, mapped to the Watson (orange) or Crick (green) strand. SV: Structural variant, SD: Standard deviation, Chr: Chromosome, CF: Cell fraction, InvDup: Inverted Duplication, Del, Deletion, Ter: Terminal.

