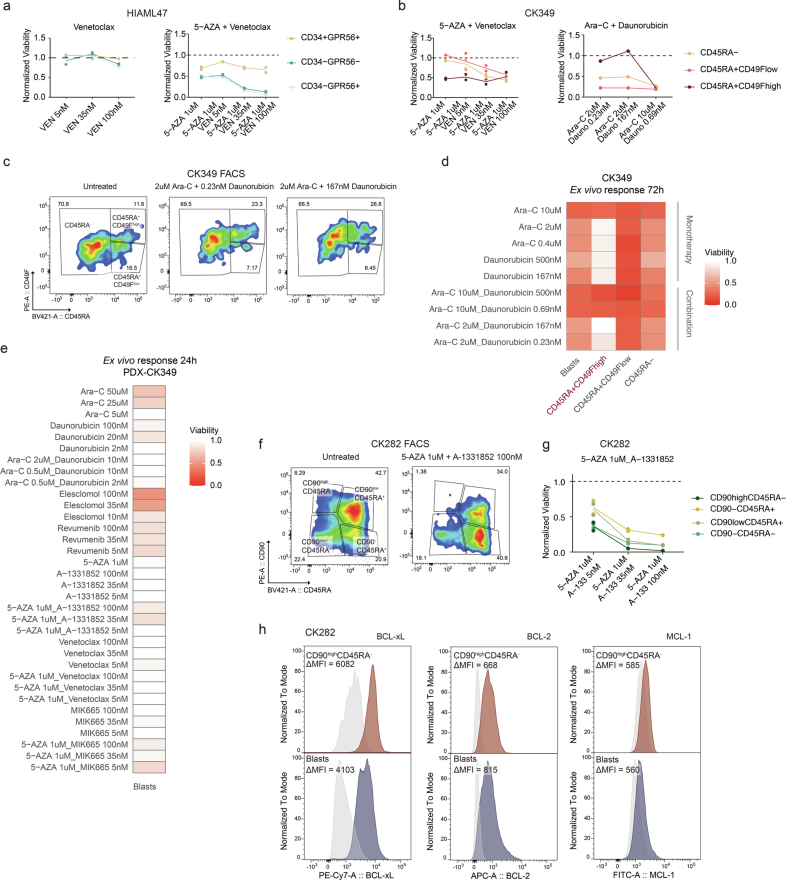
Extended Data Fig. 9. Ex vivo drug screening in CK-AML.
a Viabilities of different populations in HIAML47 after 24 h ex vivo exposure with indicated concentrations of venetoclax (left) and venetoclax together with azacitidine (right). b Viabilities of different populations in CK349 after 24 h ex vivo exposure with indicated concentrations of azacitidine and venetoclax (left) and 72 h ex vivo exposure with indicated concentrations of cytarabine together with daunorubicin (right). c FACS plot displaying expression of CD45RA and CD49F on pre-gated leukemic cells in CK349. The gates highlight three populations with different CD45RA and CD49F expressions. Cells from untreated (left) and cytarabine (2 uM, middle and right) together with daunorubicin-treated (0.23 nM, middle, and 167 nM, right) conditions are shown after 72 h ex vivo exposure. d Viabilities of different populations after 72 h ex vivo exposure with indicated concentrations of cytarabine and daunorubicin in CK349. Engraftment-driving population is highlighted in red. e Viabilities of human blasts after 24 h ex vivo exposure with indicated concentrations of 12 treatment conditions in the patient-derived xenograft (PDX) of CK349. Shown are the mean viabilities of two replicates. f FACS plot displaying expression of CD45RA and CD90 on pre-gated leukemic cells in CK282. The gates highlight four populations with different CD45RA and CD90 expressions. Cells from untreated (left) and BCL-xL inhibitor-treated (A-1331852, 100 nM) together with hypomethylating agent (5-AZA, 1 uM, right) conditions are shown after 24 h ex vivo exposure. g Viabilities of different populations in CK282 after 24 h ex vivo exposure with indicated concentrations of venetoclax together with azacitidine. h Fluorescence intensity of BCL-xL (left), BCL-2 (middle) and MCL-1 (right) protein expression in CD90highCD45RA− cells (red) compared to all blasts (blue) in CK282. Delta mean fluorescence intensity (MFI) shown at the top of the plots was calculated as the difference in MFI between the specific protein expression (colored histogram) and its IgG control (grey histogram) in the assessed population. Ex vivo viabilities were calculated as the fraction of viable cells compared to untreated control. VEN: Venetoclax, 5-AZA: Azacitidine, Ara-C: Cytarabine, Dauno: Daunorubicin.

