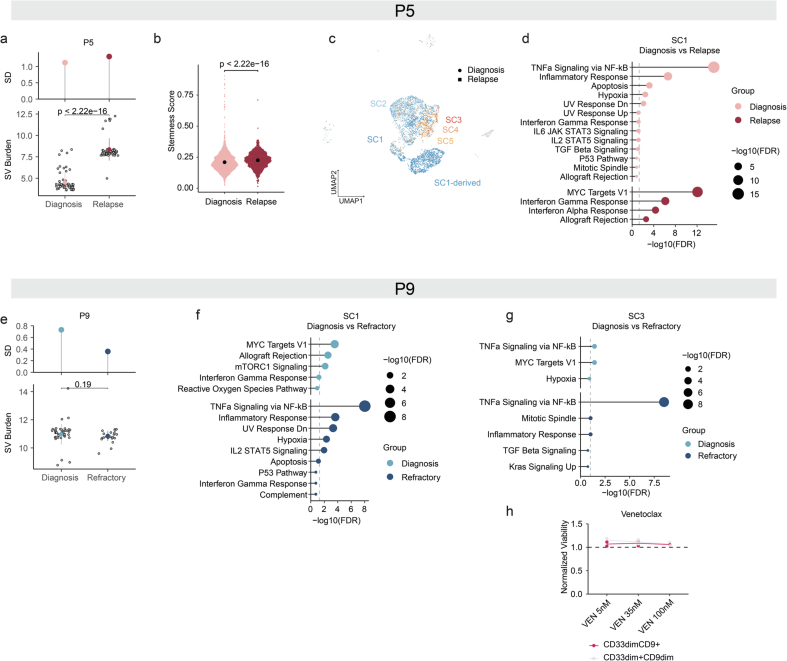
Extended Data Fig. 10. Longitudinal evolution of CK-AML under therapy stress.
a Karyotype heterogeneity between diagnosis and relapse cells in patient P5 based on structural variant (SV) burden (bottom) and its standard deviation (SD; top). Each grey dot represents a single cell. The structural variant burdens were compared using two-tailed Wilcoxon test (Diagnosis (n = 63), Relapse (n = 54)); Point ranges was defined by minima = mean - 2X standard deviation, maxima = mean + 2X standard deviation, point = mean. b Expression of the Ng et al. LSC Up transcriptomic stemness scores27 in the single cells at diagnosis vs. relapse in patient P5 (nDiagnosis = 3,444 and nRelapse = 1,102). Stemness scores between disease stages were compared using two-tailed Wilcoxon test. Expression levels of the individual genes in the score were calculated from normalized and variance stabilized counts. Beeswarm plots show the 95% confidence interval for the mean. c Weighted nearest neighbor-based UMAP plots of diagnosis and relapse leukemic cells from patient P5 CITE-seq data. Cells are colored based on subclones identified using scTRIP and are shaped based on disease stage. d Enriched pathways at diagnosis and relapse in SC1-derived cells in patient P5. Genes with FDR < 0.05 and log-fold-change > 0.25 were included in the analysis. e Karyotype heterogeneity between diagnosis and refractory cells in patient P9 based on structural variant burden (bottom) and its standard deviation (top). Each grey dot represents a single cell. The structural variant burdens were compared using two-tailed Wilcoxon test (Diagnosis (n = 44), Refractory (n = 21)); Point ranges was defined by minima = mean - 2X standard deviation, maxima = mean + 2X standard deviation, point = mean. f Enriched pathways at diagnosis and refractory disease in SC1-derived cells in patient P9. Genes with FDR < 0.05 and log-fold-change > 0.25 were included in the analysis. g Enriched pathways at diagnosis and refractory disease in SC3-derived cells in patient P9. Genes with FDR < 0.05 and log-fold-change > 0.25 were included in the analysis. h Viabilities (fraction of viable cells compared to untreated control) of different populations after 24 h ex vivo exposure with indicated concentrations of venetoclax (VEN) in P9 diagnosis cells (P9D).

