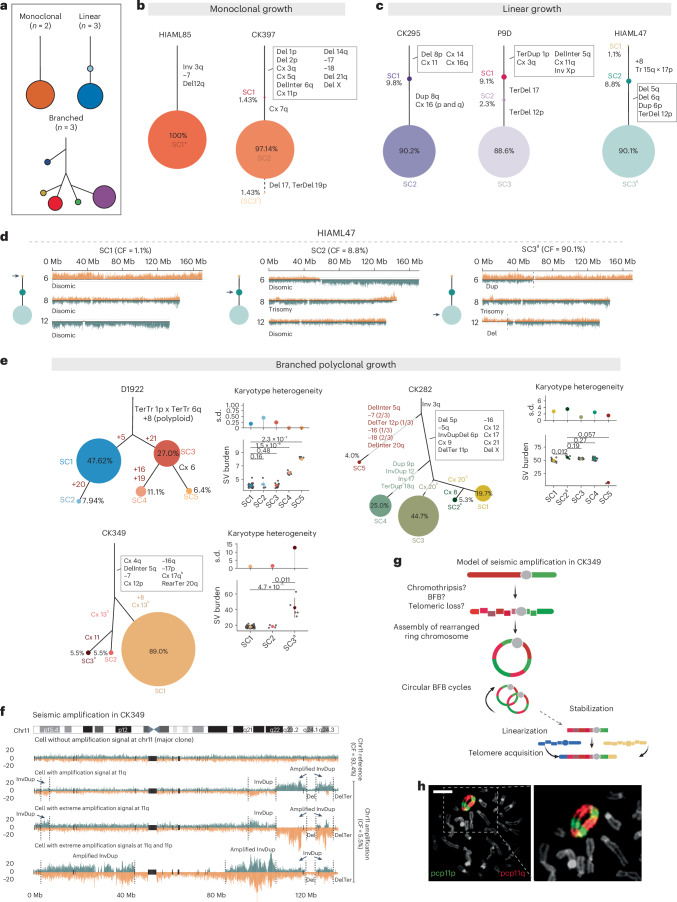
Fig. 2. CK-AML is characterized by different modes of clonal dynamics and ongoing instability.
a, Patterns of subclonal growth observed in patients with CK-AML at initial sampling. b,c, Manually curated clonal trees showing the hierarchy of somatic structural variant subclones discovered using scTRIP for samples showing monoclonal (b) and linear (c) growth. Each colored circle represents a subclone of genetically similar cells. The accumulated structural variants can be traced with solid lines toward the root. The size of the circle is proportional to the clonal population and the percentage within or next to each circle is the percentage of each clone among the total cells. d, Strand-specific read depths of chromosomes 6 (upper), 8 (middle) and 12 (bottom) in three representative single cells from HIAML47. The arrow on the clonal tree indicates the subclone represented. e, Manually curated clonal trees for samples showing branched polyclonal growth. Karyotype heterogeneity in the different subclones, which is based on structural variant burden (bottom) and its s.d. values (top), is shown next to the clonal trees. Each gray dot represents a single cell. The structural variant burden between subclones was compared using two-tailed Wilcoxon’s test (D1922: SC1 (n = 30), SC2 (n = 5) and SC3 (n = 17), SC4 (n = 7) and SC5 (n = 4); CK282: SC1 (n = 15), SC2 (n = 4), SC3 (n = 34), SC4 (n = 19) and SC5 (n = 3); CK349: SC1 (n = 5), SC2 (n = 5) and SC3 (n = 81)). Point ranges were defined by: minima = mean − 2× s.d.; maxima = mean + 2× s.d.; point = mean. f, Strand-specific read depth of four representative single cells from CK349 depicting different amplification statuses. DNA reads are colored as follows: Watson, orange; Crick, green. g, Model for the evolution of seismic amplification in CK349. Panel g created with BioRender.com. h, Two-color FISH of ring chromosome 11 from PDX of CK349 using 11p (green) and 11q (red) partial chromosome painting (pcp) probes. Scale bar, 10 μm. In b–e, the size of the circle is proportional to the clonal population. aEngraftment-driving subclone (Figs. 4 and 5). bDiffering breakpoints affecting the same chromosome. CF, cell fraction; Cx, complex; Inter, interstitial; Ter, terminal.

