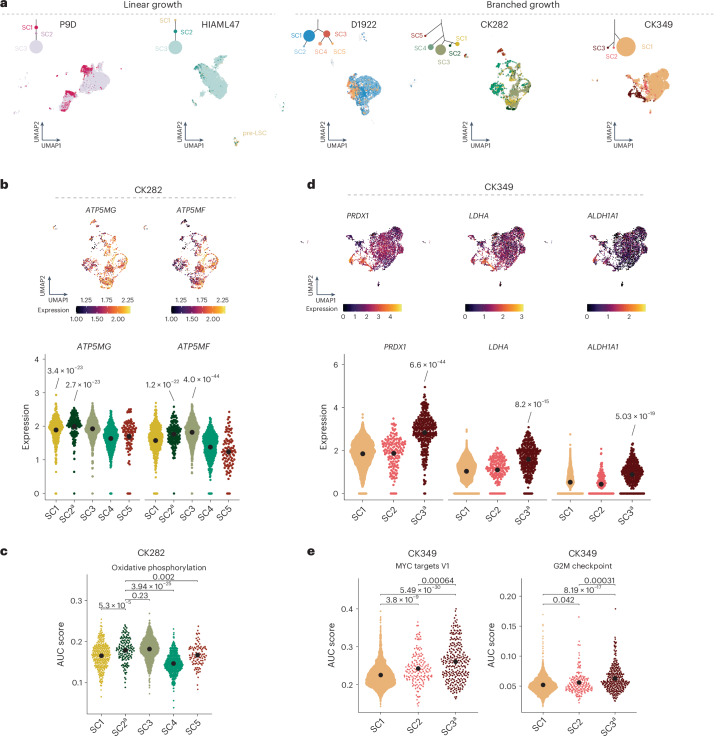
Fig. 3. Transcriptome provides mechanistic insight into subclonal architecture.
a, Weighted nearest neighbor-based UMAP plots of leukemic cells from CITE-seq data faceted by growth pattern. Cells are colored based on the subclones identified using scTRIP depicted above the UMAP in the clonal tree, with the size of the circle relative to the clonal population. Annotation of each cell was based on targeted SCNA recalling using CONICSmat. b, Expression of ATP5MG and ATP5MF in single cells and subclones in CK282 (n = 95–796 single cells). c, Area under the curve (AUC) score for activity of oxidative phosphorylation-associated gene set for each cell in the different subclones (n = 95–796 single cells). d, Expression of PRDX1, LDHA and ALDH1A1 in single cells and subclones in CK349 (n = 162–2,553 single cells). e, AUC score for activity MYC targets G2M checkpoint-associated gene sets for each cell in the different subclones (n = 162–2,553 single cells). In b–e, beeswarm plots show the 95% confidence interval (CI) for the mean, gene expression comparisons show the Padj values from two-sided, pairwise Welch t-tests between subclones and AUC scores were compared using two-tailed Wilcoxon’s test followed by Benjamini–Hochberg multiple correction testing. Expression levels of the individual genes in the score were calculated from normalized and variance-stabilized counts. aEngraftment-driving subclone (Figs. 4 and 5).

