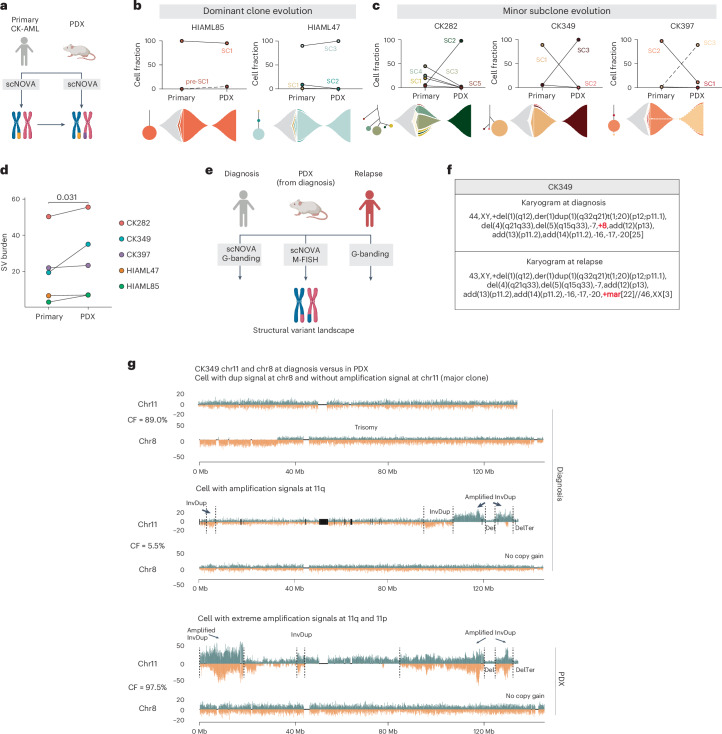
Fig. 4. Different clonal evolution patterns contribute to CK-AML reconstitution in mice.
a, Schematic of the structural variant landscape comparison between primary CK-AML samples and matched PDXs. b,c, CK-AML reconstitution is driven by dominant clone (b) or minor subclone (c). The cell fraction of subclones in the primary sample and the matching engrafted cells in the PDX model are shown. Lines connect different time points (initial sample versus PDX) of the same subclone (top). Fish plots (bottom) show the inferred clonal evolution patterns and the subclonal trees the hierarchies of somatic structural variant subclones in the primary samples, with the size of the circle relative to the clonal population. d, Mean structural variant burden in the primary CK-AML samples and matched PDX models. Each dot represents a sample. Structural variant burden between primary and PDX samples was compared using one-tailed, paired Wilcoxon’s test. e, Schematic of the structural variant landscape comparison across diagnosis, PDX and relapse samples from CK349. Panels a and e created with BioRender.com. f, G-banding karyograms of CK349 at diagnosis and at relapse. Structural variants differing between the two time points are highlighted in red. g, Depiction of two example CK349 cells at diagnosis and one in PDX with differing levels of amplification at chr11, based on no amplification at diagnosis (upper, major clone), marked amplification at diagnosis (middle, minor clone) and extreme amplification in PDX (lower, major clone). For each cell, the chr8 trisomy status is shown beneath, which scTRIP inferred to be mutually exclusive with chr11 amplification. Add, addition; Der, derivative; Mar, marker chromosome; t, translocation.

