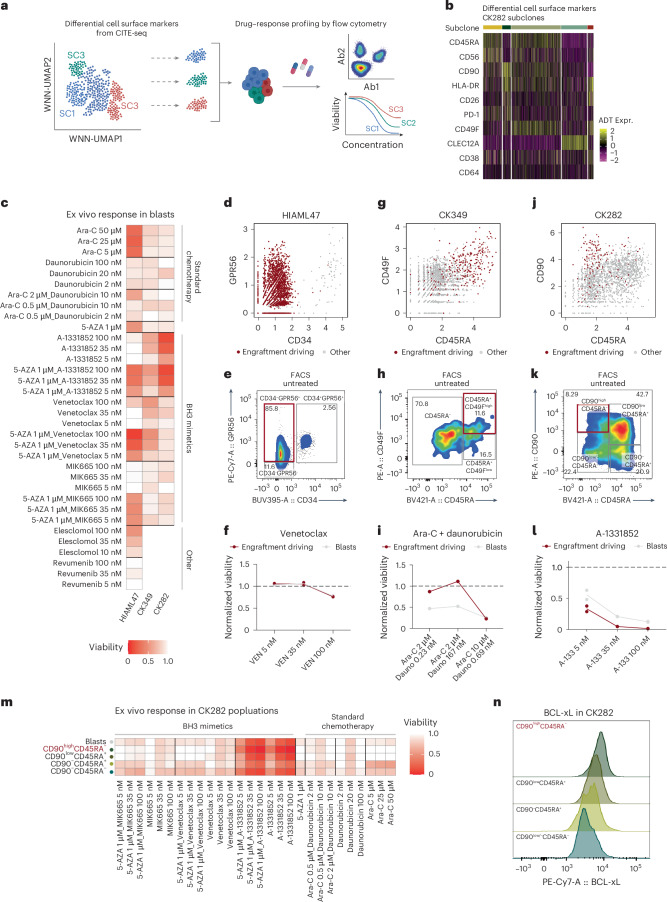
Fig. 5. Levering single-cell multiomics to dissect drug–response profiles of functional LSCs.
a, Schematic of the drug–response profiling using cell-surface proteins from CITE-seq data to capture distinct subclones by flow cytometry. Panel a created with BioRender.com. b, Heatmap showing differentially expressed cell-surface markers for subclones in CK282. c, Viabilities of blasts from three CK-AMLs after 24 h of ex vivo exposure with indicated conditions. The mean viabilities of two replicates are shown. d, Scatter plot of CD34 and GPR56 expression from HIAML47 CITE-seq data pre-gated to (pre-)leukemic cells. e, FACS plot displaying expression of CD34 and GPR56 on untreated pre-gated leukemic cells in HIAML47. Engraftment-driving LSCs are highlighted in red. f, Viabilities of engraftment-driving LSCs and all blasts in HIAML47 after 24 h of ex vivo exposure with the indicated concentrations of venetoclax. Each dot represents a replicate and the line connects the mean viabilities of the two replicates. g, Scatter plot of CD45RA and CD49F expression from CK349 CITE-seq data pre-gated to leukemic cells. h, FACS plot displaying expression of CD45RA and CD49F on untreated pre-gated leukemic cells in CK349. Engraftment-driving LSCs are highlighted in red. i, Viabilities of engraftment-driving LSCs and all blasts in CK349 after 72 h of ex vivo exposure with the indicated concentrations of cytarabine (Ara-C) and daunorubicin. j, Scatter plot of CD45RA and CD90 expression from CK282 CITE-seq data pre-gated to leukemic cells. k, FACS plot displaying expression of CD45RA and CD90 on untreated pre-gated leukemic cells in CK282. Engraftment-driving LSCs are highlighted in red. l, Viabilities of engraftment-driving LSCs and all blasts in CK282 after 24 h of ex vivo exposure with the indicated concentrations of A-1331852. Each dot represents a replicate and the line connects the mean viabilities of the two replicates. m, Viabilities of different CK282 populations after 24 h of ex vivo exposure with the indicated concentrations of standard chemotherapy regimens, as well as BH3 mimetics. The mean viabilities of two replicates are shown and engraftment-driving LSCs are highlighted in red. n, Fluorescence intensity of BCL-xL protein expression in different CK282 populations. Engraftment-driving LSCs are highlighted in red. Ex vivo viabilities were calculated as a fraction of viable cells compared with an untreated control. 5-AZA, azacitidine.

