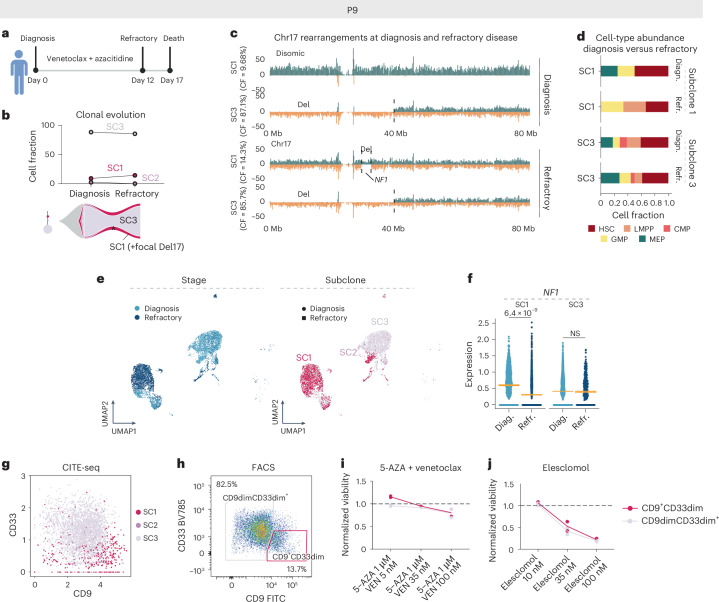
Fig. 7. Disease resistance is driven by subclone-specific mechanisms in patient P9.
a, Disease timeline for patient P9. Panel a created with BioRender.com. b, Cell fraction (CF) of patient P9 subclones at diagnosis (P9D) and refractory disease (P9R) based on the scTRIP data. The lines connect different time points (diagnosis (diagn.) versus refractory (refr.) disease) of the same subclone (top). Fish plot (bottom) shows the inferred clonal evolution pattern and the subclonal tree the hierarchy of somatic structural variant subclones at diagnosis, with the size of the circle relative to the clonal population. c, Depiction of example cells at diagnosis and refractory disease representing cells from SC1 and SC3 with differing rearrangements at chromosome 17. d, Stacked bar plots showing the fraction of indicated HSPC-like states out of all cells at diagnosis and refractory disease. Cell types were annotated using an MNase-seq reference dataset from index-sorted, healthy, CD34+ bone marrow cells and cell typing was pursued using scNOVA. e, Weighted nearest neighbor-based UMAP plots of diagnosis and refractory leukemic cells from P9 CITE-seq data. Cells are colored based on disease stage (left) and subclones identified using scTRIP (right). f, Expression of NF1 in single cells at diagnosis and refractory disease faceted based on subclone (SC1: nDiagnosis = 680 and nRefractory = 1,418; SC3: nDiagnosis = 3,130 and nRefractory = 263). Padj value from two-sided, pairwise Welch’s t-tests between disease stages is shown and beeswarm plots show the 95% CI for the mean. g, Scatter plot of CD9 and CD33 expression from CITE-seq data at diagnosis (P9D) pre-gated to leukemic cells highlighted according to subclones. h, FACS plot displaying expression of CD9 and CD33 on pre-gated leukemic cells. The gates highlight two populations with different CD9 and CD33 expressions, representing SC1- and SC3-enriched populations. i, Viabilities of different populations after 24 h of ex vivo exposure with the indicated concentrations of venetoclax together with azacitidine. j, Viabilities of different populations after 24 h of ex vivo exposure with the indicated concentrations of elesclomol. In i and j, ex vivo viabilities were calculated as a fraction of viable cells compared with an untreated control. NS, not significant.

