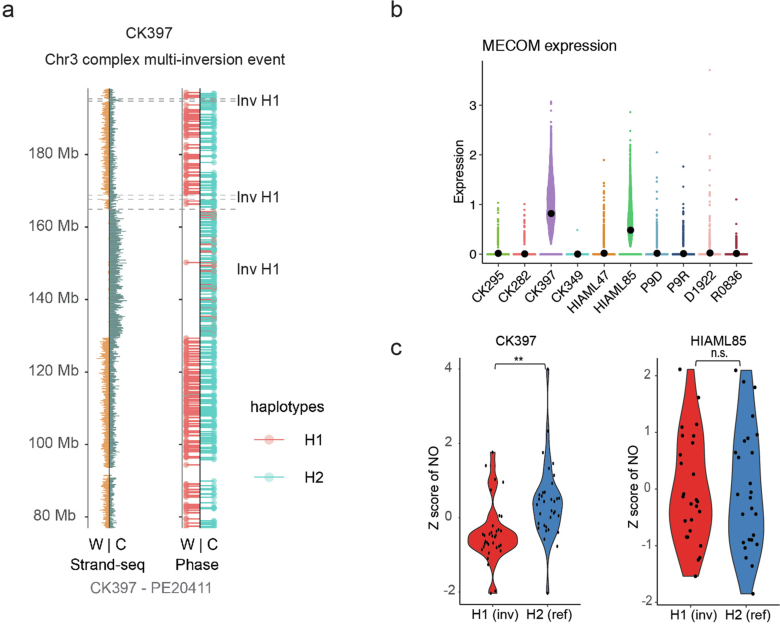
Extended Data Fig. 1. Chromosomal rearrangements at 3q and MECOM deregulation.
a Complex multi-inversion event in CK397 at chromosome 3. Shown is strand-specific read depth (left) separated into the phase data channel (right) of a representative CK397 cell. Reads denoting somatic structural variants, discovered using scTRIP, mapped to the Watson (W; orange) or Crick (C; green) strand. Reads overlapping single nucleotide polymorphisms were assigned to haplotype H1 (red lollipops) or H2 (blue lollipops). Grey: single cell IDs. b Expression of MECOM in single cells in primary CK-AML patient samples. Beeswarm plots show the 95% confidence interval for the mean. c Violin plot showing haplotype-specific nucleosome occupancy (NO) at the MECOM gene body (10% FDR) for HIAML85 and CK397. Nucleosome occupancy was assessed from all informative cells in which reads could be phased (WC or CW configuration) (n = 26 and 34 cells, respectively). H1 contains the inversion resulting in RPN1-MECOM rearrangement whereas H2 is normal at MECOM locus. Gene-body nucleosome occupancy measurements from both haplotypes were converted into log2-scale and compared using two-tailed Wilcoxon test. Chr: Chromosome, Inv: Inversion.

