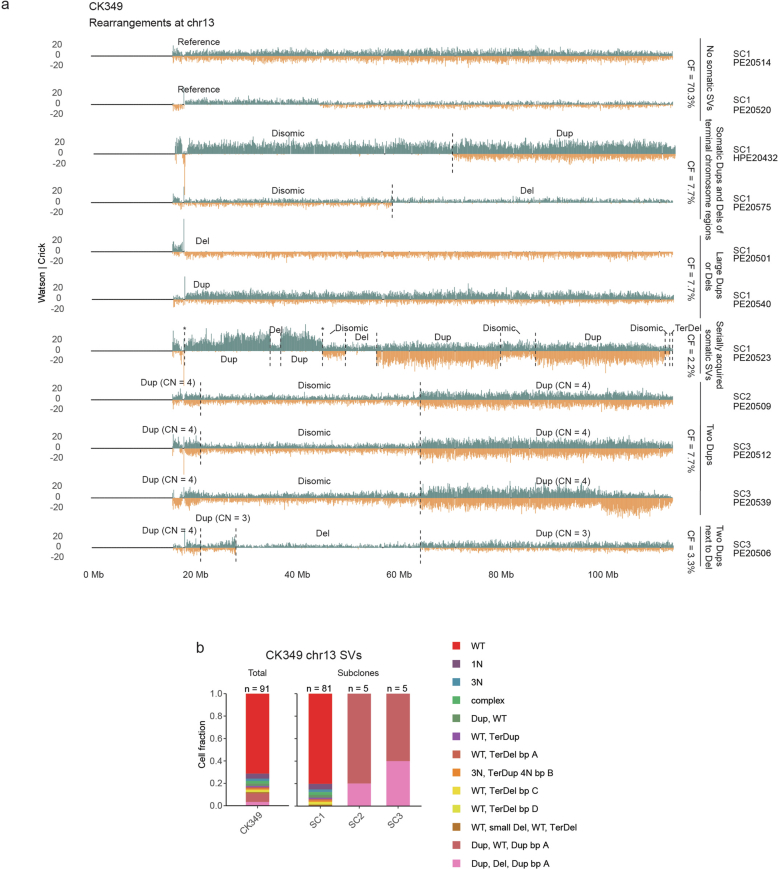
Extended Data Fig. 2. Genomic rearrangements at chromosome 13 in CK349.
a Strand-specific read depth of representative single cells from CK349 showing different rearrangements detected at chromosome 13 in different subclones. Reads denoting somatic structural variants, discovered using scTRIP, mapped to the Watson (orange) or Crick (green) strand. b Stacked barplot showing the cell fraction of different rearrangements detected at chromosome 13 in CK349 at diagnosis. The number of cells is indicated on top of the bar and the distinct rearrangements are labelled below. CF: Cell fraction, SV: Structural variant, Chr: Chromosome, Dup: Duplication, Del: Deletion, Ter: Terminal, CN: Copy number, WT: Wild-type, bp: Break point.

