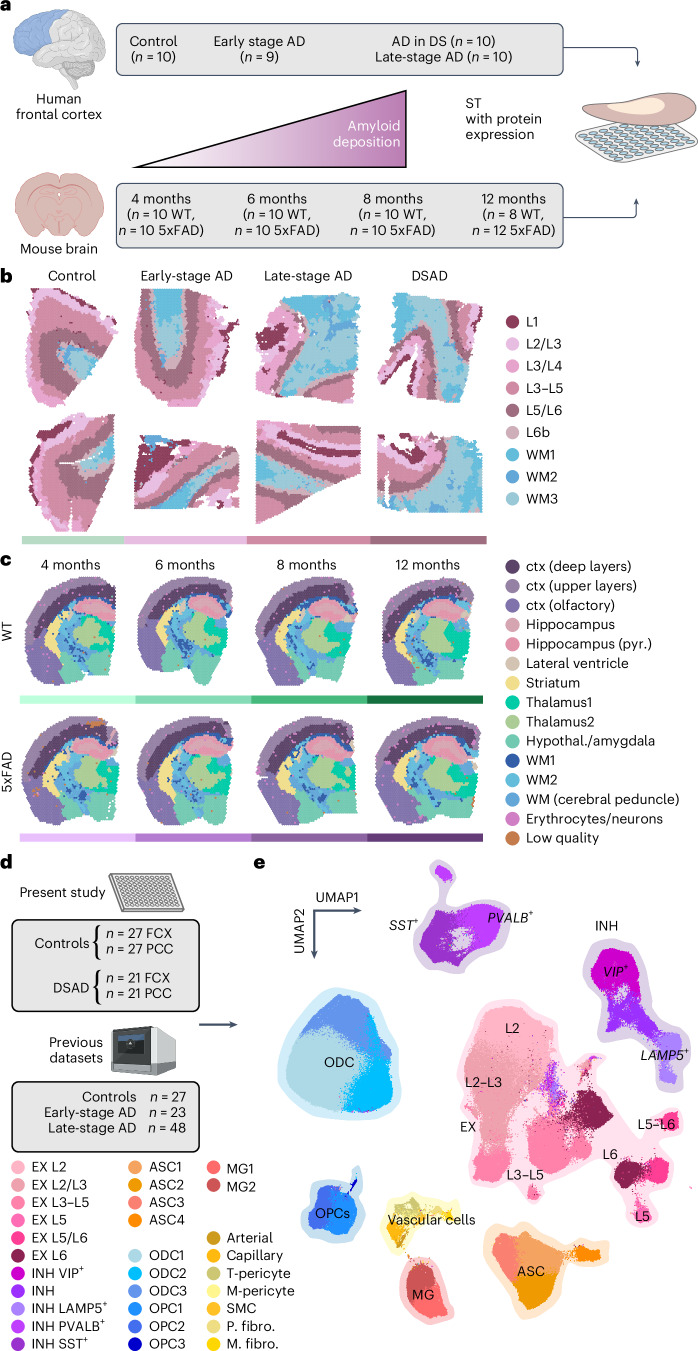
Fig. 1. ST and single-nucleus transcriptomic analysis of genetic and sporadic forms of AD.
a, We performed ST experiments in the human frontal cortex and the mouse brain using 10x Genomics Visium. Human samples—n = 10 cognitively normal controls, n = 9 early-stage AD, n = 10 late-stage AD and n = 10 DSAD (median 1,316 genes per spot; n = 115,251 ST spots; Supplementary Table 1). Mouse samples—n = 10 WT and n = 10 5xFAD aged 4 months; n = 10 WT and n = 10 5xFAD aged 6 months; n = 10 WT and n = 10 5xFAD aged 8 months; n = 8 WT and n = 12 5xFAD aged 12 months (median 2,438 genes per spatial spot; n = 212,249 ST spots; Supplementary Table 2). b, Two representative human ST samples from each of the disease conditions, each spot colored by cortical annotations from BayesSpace22 clustering analysis. c, One representative mouse ST sample from WT and 5xFAD at each time point, each spot colored by brain region annotations derived from BayesSpace clustering analysis. d, We performed snRNA-seq in the frontal cortex and PCC from cognitively normal control donors (n = 27 FCX and n = 27 PCC) and DSAD donors (n = 21 FCX and n = 21 PCC). We also included snRNA-seq data from three previous studies of the cortex in AD7–9 (n = 27 controls, n = 23 early-stage AD and n = 48 late-stage AD). e, UMAP plot depicting a two-dimensional view of the cellular neighborhood graph of 585,042 single-nuclei transcriptome profiles. Each point in this plot represents one cell, colored by their cell-type annotations derived from Leiden clustering58 analysis. EX, n = 229,041; INH, n = 90,718; MG, n = 20,197; ASC, n = 57,443; OPC, n = 23,053; ODC, n = 153,182; PER, n = 4,659; END, n = 3,637; FBR, n = 2,403 and SMCs, SMC, n = 709. See Table 1 for additional cluster name abbreviations. Illustrations were created with Biorender.com. EX, excitatory neurons; INH, inhibitory neurons; MG, microglia; ASC, astrocytes; ODC, oligodendrocytes; PER, pericytes; END, endothelial cells; FBR, fibroblasts; SMCs, smooth muscle cells.

