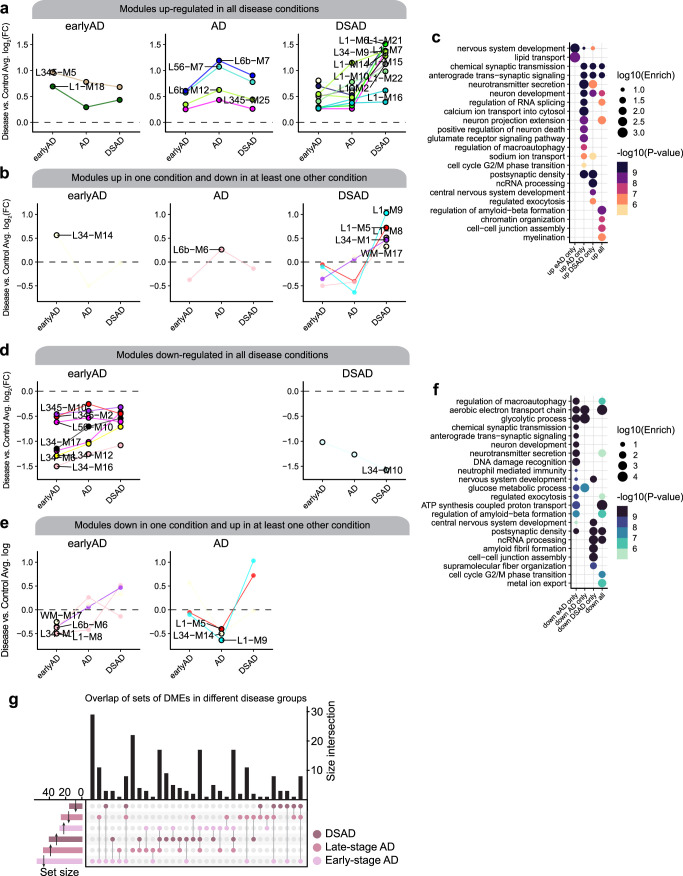
Extended Data Fig. 3. Differential module eigengenes (DMEs) among disease conditions.
a, DMEs that are upregulated in all disease conditions compared to control. Modules are grouped into different plots based on which disease condition had the highest effect size. Higher fold change values correspond to modules that are upregulated in disease. b, DMEs that are upregulated in one condition and downregulated in at least one other condition. c, Selected pathway enrichment results for the top 25 hub genes for each module for the set of modules upregulated in different disease conditions. d, DMEs that are downregulated in all disease conditions compared to control, similar to a. e, DMEs that are downregulated in one condition and upregulated in at least one other condition. f, Selected pathway enrichment results for the top 25 hub genes for each module for the set of modules downregulated in different disease conditions. g, Upset plot showing the overlap between sets of differentially expressed modules in each disease group. One-sided Fisher’s exact test was used for enrichment analysis.

