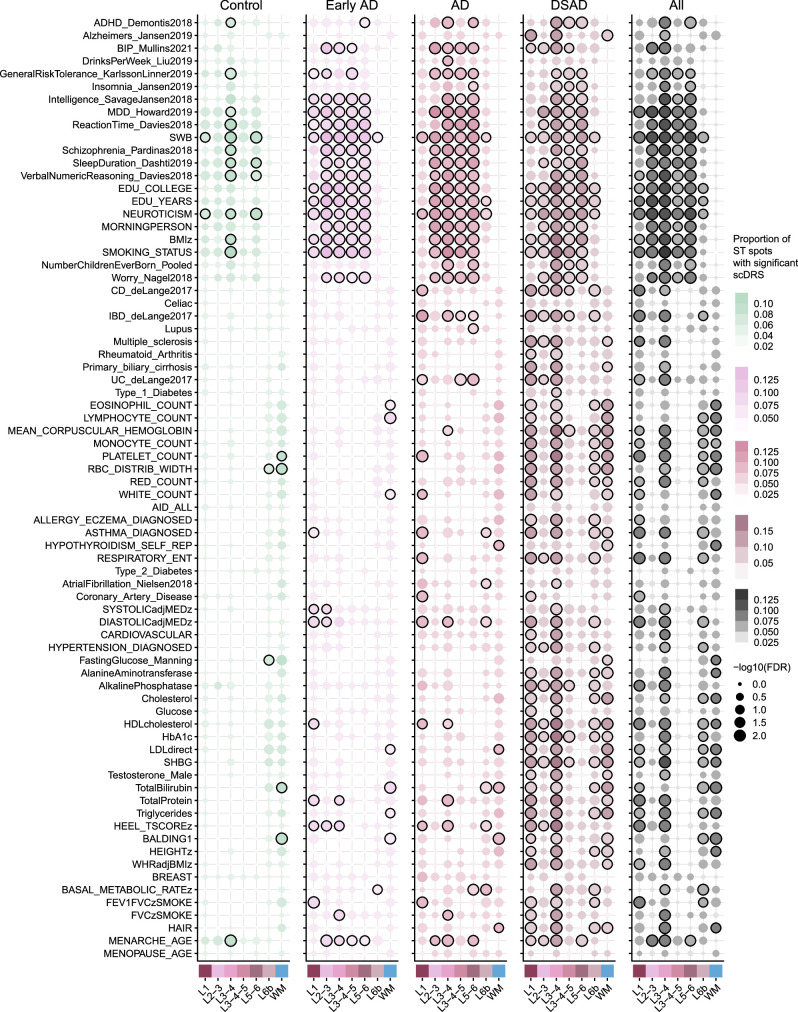
Extended Data Fig. 4. Genetic enrichment analysis in human spatial transcriptomics.
Dot plots showing the results of genetic enrichment analysis performed in the human Visium ST dataset using scDRS. The scDRS Python package was run on the human ST dataset to compute spatial transcriptomic disease relevance scores (st-DRS) across a corpus of 74 traits provided by the scDRS package, resulting in spot-level disease enrichment scores and significance levels. Gene-trait association information was derived from the scDRS package, which was compiled from several genetic studies37,81–90 A Monte Carlo (MC) test was used to test for group-level significance between each trait and the ST clusters, separately for each disease group and the entire dataset together (all, right side). Black outlines on the dots denote a significant group-level association (FDR ≤ 0.05).

