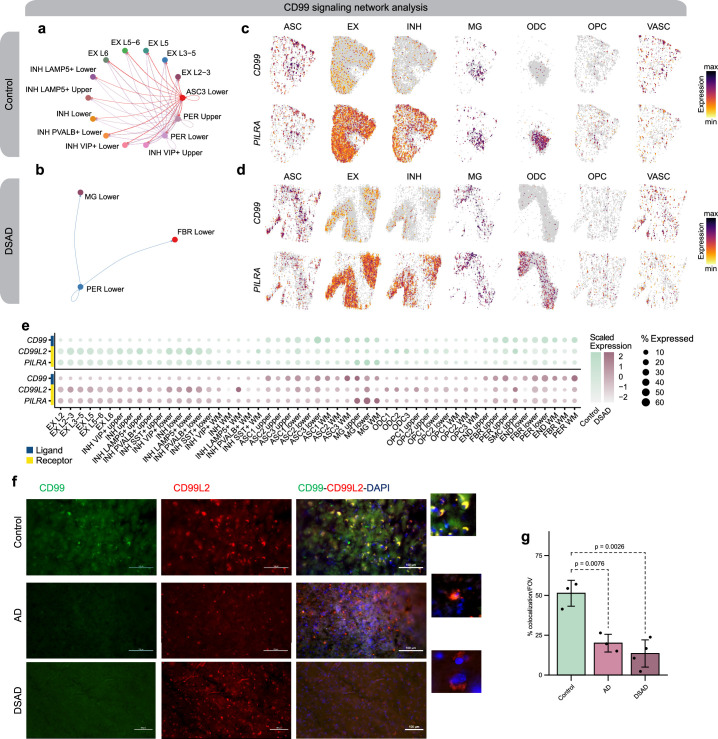
Extended Data Fig. 8. CD99 signaling changes between DSAD and control.
a,b, Network plot showing the CCC signaling strength between different cell populations in controls (a) and DSAD (b) for the CD99 signaling pathway. c,d, Spatial feature plots of the snRNA-seq in predicted spatial coordinates for one control sample (c) and one DSAD sample (d) for one ligand and one receptor in the CD99 pathway. e, Dot plot showing gene expression in the snRNA-seq dataset of ligands and receptors in the CD99 signaling pathway with significant interactions based on CellChat. f, Representative double immunofluorescence images for CD99 (green), CD99L2 (red) and DAPI (blue) from postmortem human brain tissue (prefrontal cortex, PFC) of control, AD and ADDS cases. Images were captured using a Nikon ECLIPSE Ti2 inverted microscope. g, Bar graph representing results of colocalization analysis from ×60 images (n = 3 cognitively healthy control, n = 3 AD and n = 4 DSAD cases) using the JACoP Plugin from ImageJ and Manders’ correlation coefficient. Data are presented as the average of three different fields of view (FOVs) per sample. P-values from two-way t-tests are shown.

