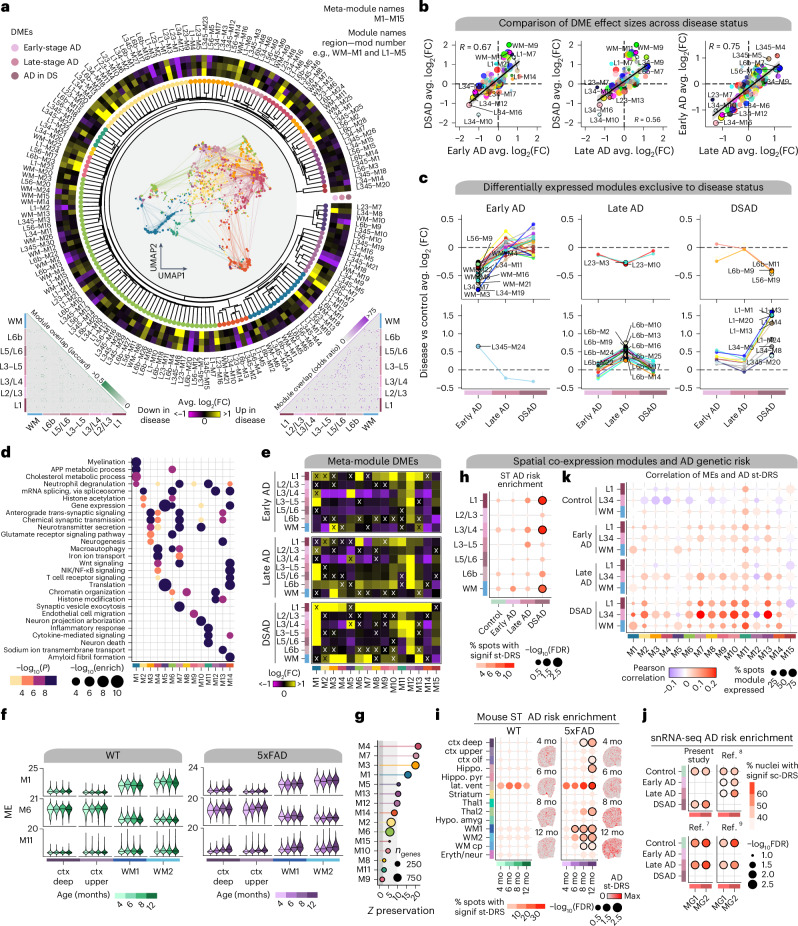
Fig. 3. System-level analysis of spatial gene expression programs.
a, Dendrogram shows 166 co-expression modules grouped into 15 meta-modules. Network plot represents the consensus co-expression network; each dot is a gene colored by meta-module assignment. Heatmap shows effect sizes from DME testing. Triangular heatmaps show the distance of gene sets and expression between modules (left, Jaccard; right, odds ratio). b, Comparison of effect sizes from DME testing across disease groups. Black lines linear regression with a 95% confidence interval around the mean in gray. c, Lineplots showing differentially expressed modules specific to disease groups. Top, downregulated modules. Bottom, upregulated modules. d, Selected pathway enrichment results for each meta-module. One-sided Fisher’s exact test was used for enrichment analysis. e, Heatmaps of meta-module DMEs in each disease group compared to controls. X indicates a lack of statistical significance. f, Violin plots showing MEs of selected meta-modules in mouse ST, split by age, with black line indicating the median ME. g, Lollipop plot showing module preservation analysis of the meta-modules projected into the 5xFAD mouse dataset. Z-summary preservation > 10, highly preserved; 10 > Z-summary preservation > 2, moderately preserved and 2 > Z-summary preservation, not preserved. h, st-DRS for AD in human ST clusters. Black outlines on the dots denote a significant group-level association (Monte Carlo test false discovery rate (FDR) ≤ 0.05). i, st-DRS for AD computed in mouse ST clusters. Feature plots show the st-DRS scores for representative samples in WT and 5xFAD. j, Single-cell disease relevance scores for AD in microglia in the snRNA-seq dataset, split by dataset and disease status. k, Dot plots show the percentage of ST spots in each group as the size and the correlation of the MEs and the scDRS AD enrichment as the color. mo, month.

