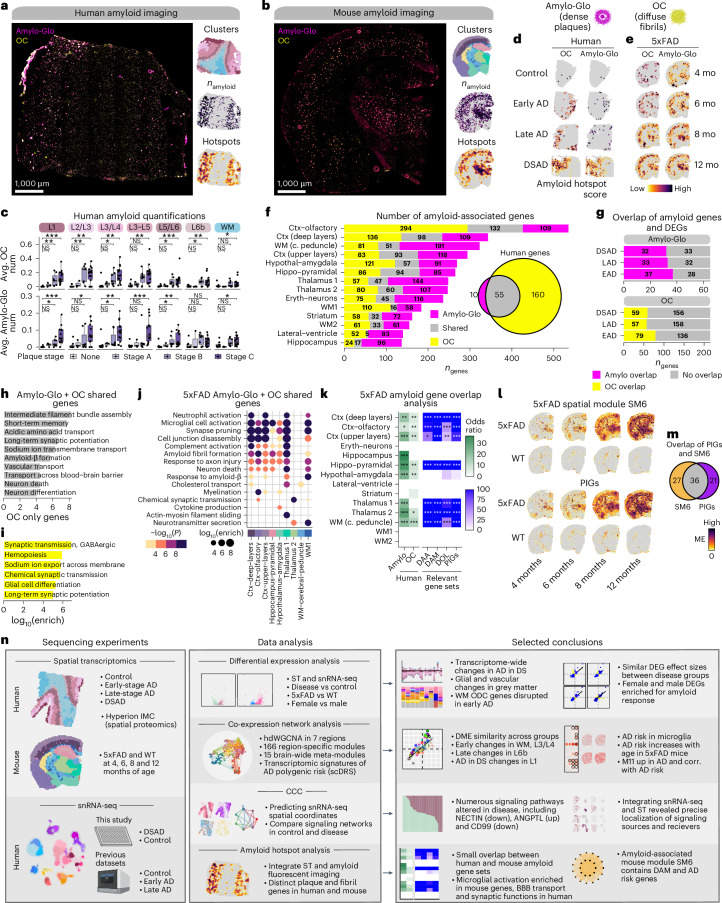
Fig. 7. Amyloid-associated gene expression signatures.
a,b, Representative fluorescent images from DSAD (a) and 12-month 5xFAD (b) stained with Amylo-Glo and OC to mark dense amyloid plaques and diffuse amyloid fibrils, respectively. ST data colored by cluster, amyloid quantification and hotspot analysis are below the images. c, Box and whisker plots showing the distribution of amyloid quantifications in the human ST dataset, stratifying samples by neuropathological plaque staging. Box boundaries and lines correspond to the IQR and median, respectively. Whiskers extend to the lowest or highest data points that are no further than 1.5 times the IQR from the box boundaries. Number of samples per stage—none, n = 8; stage A, n = 3; stage B, n = 7 and stage C, n = 14. Two-sided Wilcoxon test was used for pairwise comparisons. d,e, Amyloid hotspot results (Getis-Ord Gi*) for human (d) and mouse (e). f, Number of amyloid-associated genes from Amylo-Glo, shared and OC for mouse clusters. Euler diagram shows the overlap of Amylo-Glo- and OC-associated genes in the human dataset. g, Number of Amylo-Glo- and OC-associated genes that overlap with disease DEGs. h,i, Selected pathway enrichment results from amyloid-associated genes that were shared between Amylo-Glo and OC (h) and OC-specific (i) in the human ST dataset. j, Selected pathway enrichment results from amyloid-associated genes shared between Amylo-Glo and OC in the mouse ST dataset. One-sided Fisher’s exact test was used for enrichment tests. k, Heatmap showing gene set overlap results of mouse and human amyloid-associated genes, as well as with other gene sets (DAA19, DAM18, DOL54 and PIGs53). NS, P > 0.05; *P ≤ 0.05; **P ≤ 0.01; ***P ≤ 0.001, ****P ≤ 0.0001. l, Expression of SM6 and PIGs modules in representative mouse ST samples. m, Euler plot showing overlap of the SM6 and PIGs53. n, Overview of the experiments, data analysis and selected conclusions of this entire study. Illustrations were created with Biorender.com. DAA, disease-associated astrocytes; DAM, disease-associated microglia; DOL, disease-associated oligodendrocytes; BBB, blood–brain barrier.

