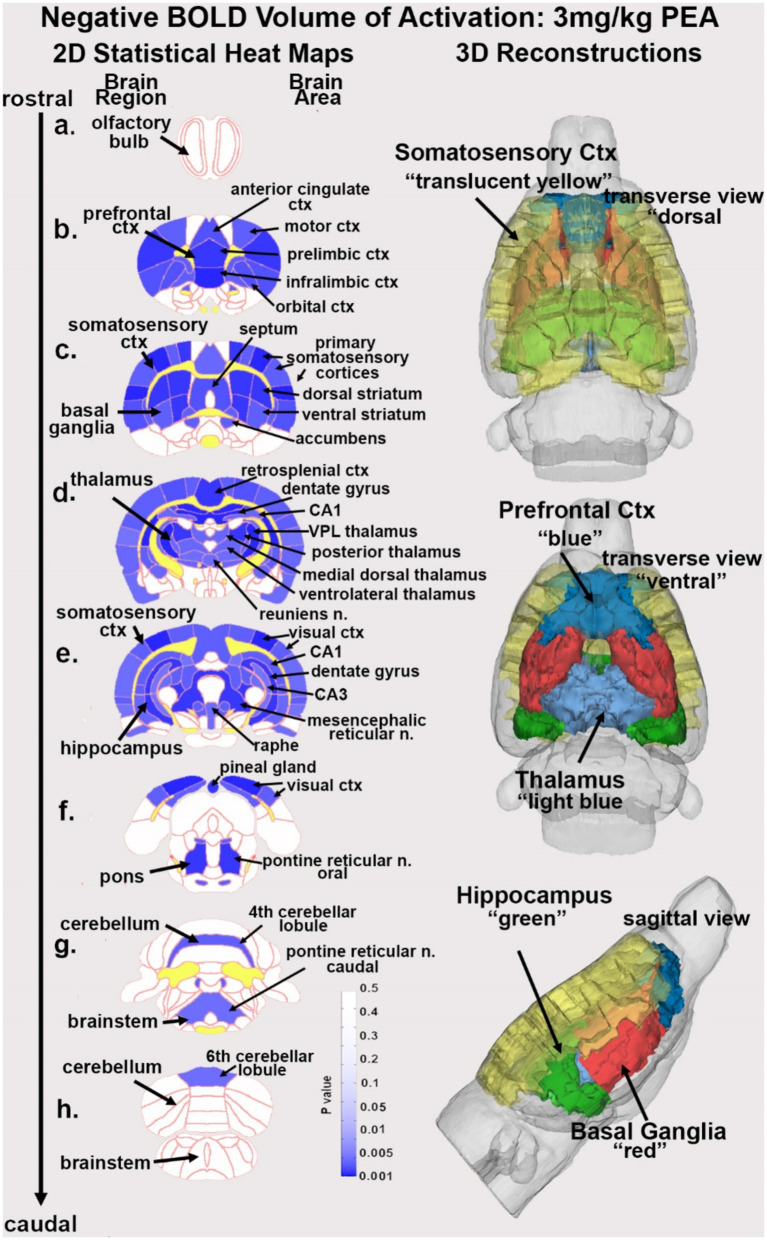
Figure 1.
Change in BOLD signal with low dose PEA. Depicted are 2D heat maps of coronal sections (a-h) showing the location of brain areas that were significantly different in negative BOLD signal (blue highlight) between vehicle and low dose (3.0 mg/kg) PEA. These highlighted areas represent a PEA-induced increase in negative BOLD signal over vehicle. White matter tracts are highlighted in yellow. The brain regions are noted on the left of the section and brain areas on the right. The 3D color-coded reconstructions summarize the major brain areas that were significantly different. n. = nucleus.

