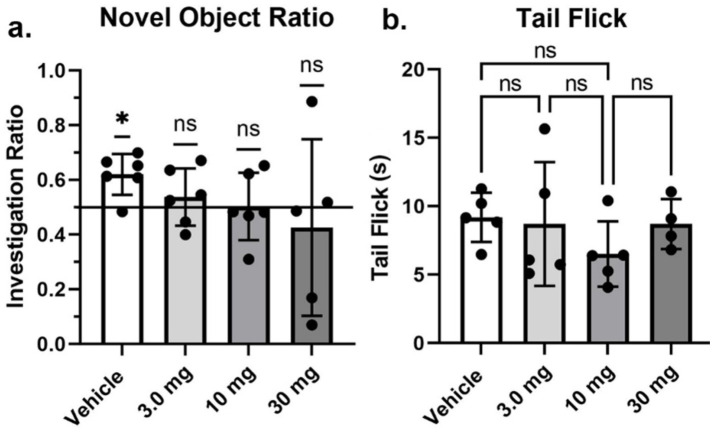
Figure 3.
Novel object recognition and tail flick. Shown are scatter plots (mean ± SD) of the dose-dependent changes in the investigation ratio in the Novel Object Recognition task, and latency in seconds to withdraw the tail in the Tail flick assay. The black dots are each rat in the experiment (*p < 0.05), nonsignificant (ns).

